A throughline of the early owner Steve Cohen years was that the New York Mets strived to be competitive while building up their farm system. The goal was to bridge to future younger players by relying on short term, high annual average value (AAV) bridge deals. They also preferred to stay away from players with a qualifying offer in order to protect their drafts.
This meant that in free agency they largely limited themselves to players willing to take short-term deals. For the most part those players were either older stars towards the end of their careers like Max Scherzer, Justin Verlander and J.D. Martinez or reclamation projects looking for a bounce back like Luis Severino and Harrison Bader.
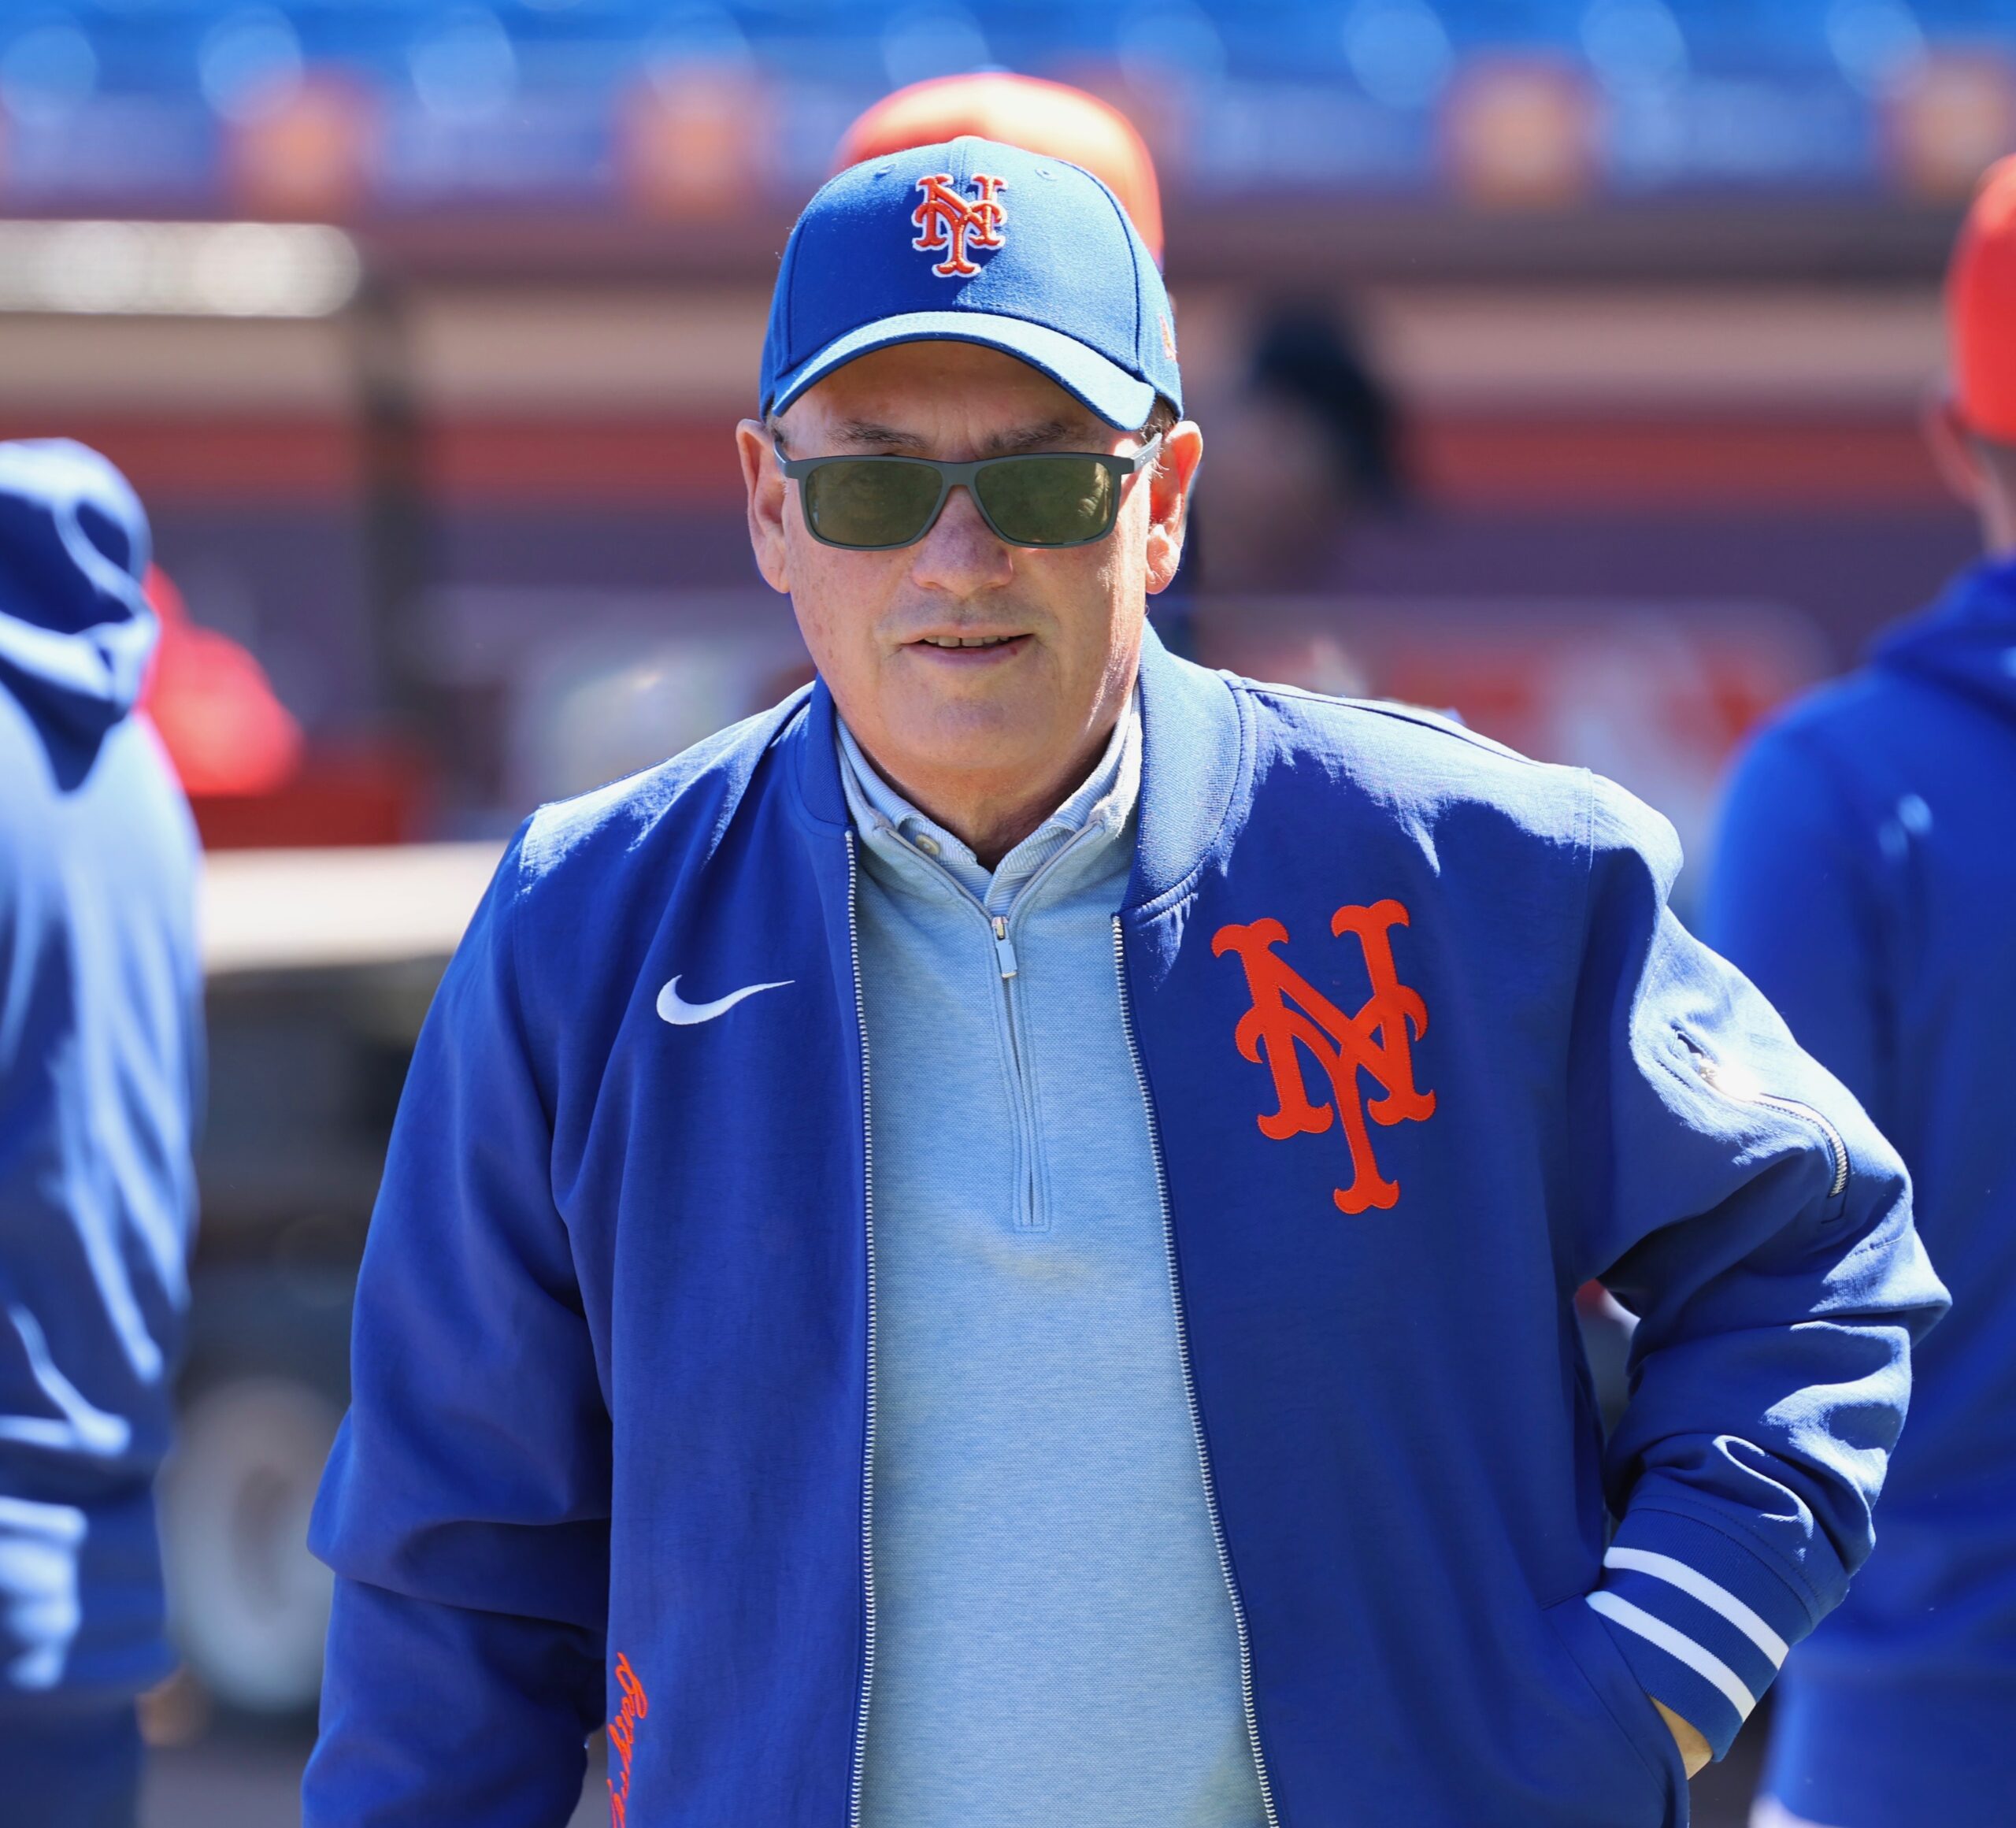
Steve Cohen. Photo by Ed Delany of Metsmerized
How Old Have the Mets Been?
From 2021-2023 the Mets were one of the oldest teams in baseball. This was especially true on the pitching side.
| 2021-2023 Mets | Hitting | Pitching |
|---|---|---|
| Rank, average age | 29th | 29th |
| Average age | 29.1 | 29.9 |
| Rank, age per PA / IP | 26th | 30th |
| Age per PA / IP | 29.1 | 30.9 |
| League average age per PA / IP | 28.3 | 28.8 |
This strategy worked well for the most part in 2022 as the Mets won 101 games, but the team seemed to breakdown as the season went on, limping to the postseason and only winning one wild card game. It did not work well in 2023 and the Mets sold at the deadline.
In 2024, the Mets had one of their best seasons making it to the NLCS. Across 2024-25 they were still one of the oldest teams in the sport and, similar to 2022, the 2025 team slowed down as the season went on and missed the playoffs. Many factors outside of just age contributed to this.
| 2024-2025 Mets | Hitting | Pitching |
|---|---|---|
| Rank, average age | 29th | 29th |
| Average age | 30.0 | 30.3 |
| Rank, age per PA / IP | 28th | 30th |
| Age per PA / IP | 29.9 | 30.8 |
| League average age per PA / IP | 28.3 | 29.2 |
In 2026, the Mets got younger. They finally started to show off the vision Cohen spoke about since he bought the team, giving significant playing time to homegrown rookies including Carson Benge, Nolan McLean and A.J. Ewing, as well as 27-year-old Christian Scott. Zac Thornton, Jonah Tong, and Nick Morabito also got run. The Mets still have many older players on their roster like Marcus Semien but this is the most youth balance of the Cohen era.
| 2026 Mets | Hitting | Pitching |
|---|---|---|
| Rank, average age | 23rd | 29th |
| Average age | 28.5 | 30.4 |
| Rank, age per PA / IP | 13th | 21st |
| Age per PA / IP | 27.6 | 29.7 |
| League average age per PA / IP | 27.8 | 29.0 |
Breaking Down Playoff Teams
So what does all this mean? Does youth automatically lead to wins? Clearly it is not that simple since the Mets won the second fewest games of the Cohen era in 2026. The Nationals had the youngest offense based on plate appearances (PA) and the 13th youngest pitching staff based off inning pitched (IP) and only won three more games than the Mets.
How have playoff teams compared to the league average age per each season? The following is based on age per PA and age per IP.
| Year | League avg hitter age | Playoff teams hitter age | League avg pitcher age | Playoff teams pitcher age |
|---|---|---|---|---|
| 2021 | 28.3 | 28.7 | 28.6 | 29.0 |
| 2022 | 28.2 | 28.3 | 28.7 | 29.1 |
| 2023 | 28.0 | 28.3 | 28.8 | 29.0 |
| 2024 | 27.9 | 28.2 | 28.9 | 29.3 |
| 2025 | 27.9 | 28.4 | 29.1 | 29.2 |
| 2026 | 27.8 | 28.6 | 29.0 | 29.2 |
| All years | 28.0 | 28.4 | 28.8 | 29.1 |
In each season the ages of the players in the playoffs averaged sightly older than the leagues average. Meanwhile, teams that missed averaged slightly younger.
| Year | League hitter age | Non-playoff hitter age | League pitcher age | Non-playoff pitcher age |
|---|---|---|---|---|
| 2021 | 28.3 | 28.2 | 28.6 | 28.4 |
| 2022 | 28.2 | 28.2 | 28.7 | 28.4 |
| 2023 | 28.0 | 27.7 | 28.8 | 28.8 |
| 2024 | 27.9 | 27.7 | 28.9 | 28.5 |
| 2025 | 27.9 | 27.5 | 29.1 | 29.0 |
| 2026 | 27.8 | 27.2 | 29.0 | 28.8 |
| All years | 28.0 | 27.8 | 28.8 | 28.6 |
Naturally, it is not as simple as saying you do not want a young team to make the playoffs. Teams in a rebuild are going to skew both the age of non-playoff teams and the overall league average.
Here is how the age ranges break down playoff to non-playoff teams:
| Age band | Playoff teams hitters (% of PA) | Non-playoff teams hitters (% of PA) | Playoff teams pitchers (% of IP) | Non-playoff teams pitchers (% of IP) |
|---|---|---|---|---|
| Under 26 | 24.3% | 28.4% | 17.0% | 20.6% |
| 26-32 | 61.5% | 60.9% | 63.3% | 63.2% |
| 33+ | 14.2% | 10.7% | 19.6% | 16.3% |
By playing time it would appear that having more veterans playing is the key to making the playoffs, but where is the bulk of the production actually coming from?
| Age band | League (WAR) | Playoff teams (WAR) | Non-playoff teams (WAR) |
|---|---|---|---|
| Under 26 | 8.0 | 9.8 | 6.9 |
| 26-32 | 21.1 | 27.4 | 17.2 |
| 33+ | 4.1 | 6.7 | 2.6 |
| Total | 33.3 | 43.9 | 26.7 |
This is the key. Teams who made the playoffs on average saw players in their primes, ages 26-to-32 vastly outpace non-playoff teams. Veterans and young players did as well, but the true gap came from players in their primes.
Teams do not just want to be younger and more athletic, they want to line up as much production from above average players in their primes as they can without dedicating too much playing time to players either past their primes or rookies still adapting to the majors.

Brad Penner-Imagn Images
Where Should The Mets Go?
Fangraphs’ roster resource tool has the Mets’ lineup and pitching staff projected for the 2027 season. Using standard PA averages per spot in the batting order and accounting for both player PA averages the last five years as well as platoons like Jared Young/Mark Vientos the rough breakdown of age comes out to:
| Age band | Mets hitters (% of PA) | Mets pitchers (% of IP) |
|---|---|---|
| Under 26 | 28.7% | 25.4% |
| 26-32 | 60.6% | 47.2% |
| 33+ | 10.7% | 27.4% |
As the Mets stand, they skew very old when it comes to pitchers and young when it comes to hitters. Youth on the pitching should be a priority going forward over continued starts from older players like Kodai Senga, and with so many pitching prospects nearing the majors that should be very attainable for the Mets.
On the offensive side, the Mets could benefit from some short-term, floor raising established players to round out the edges of the roster replacing players like Mark Vientos and Ronny Mauricio.
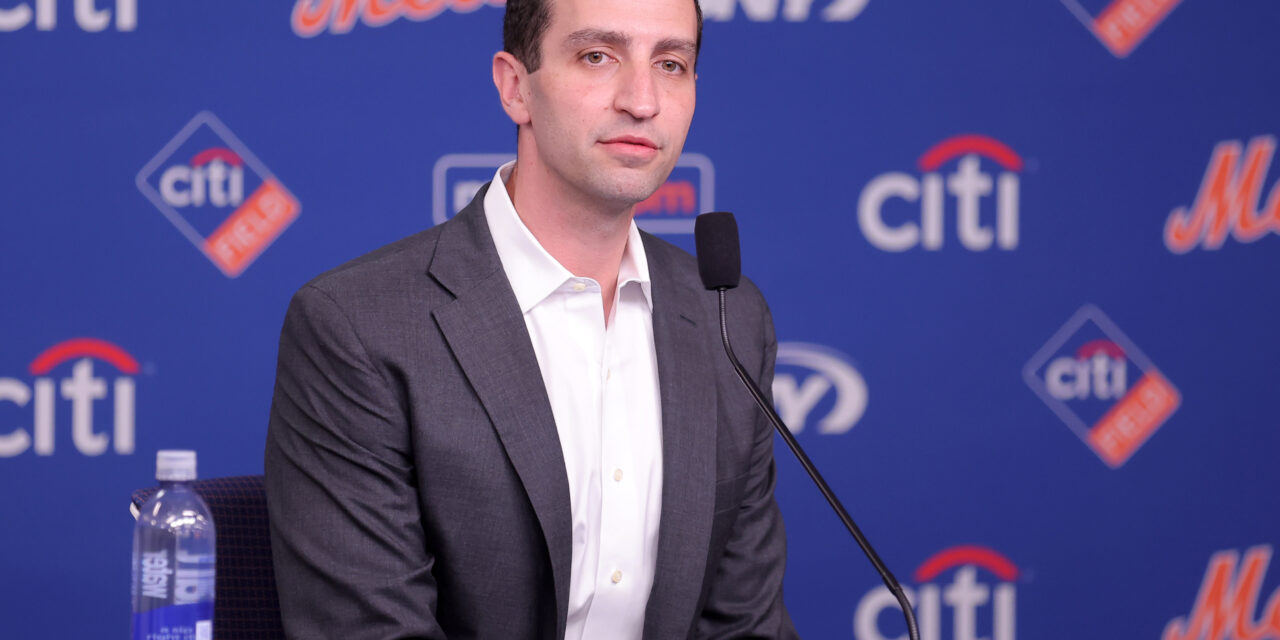
In terms of this projection, the Mets’ offense shares similarities with the current Milwaukee Brewers, who overall skew younger. It should not be a surprise as current Mets president of baseball operations David Stearns helped acquire many of those current Brewers players and set in place the processes the team still utilizes.
Overall, a roster of strong performing players in their prime seems to be the clearest way to success, which seems straightforward and makes sense. The harder part is how to get there as few players hit free agency in the early parts of their prime. The two main ways to get those players is either through development or through trades.
Steve Cohen’s vision since he took over the team was to have a strong farm system filling the core of this roster and the data above shows why. For sustained success, free agency is best utilized for superstars and for filling out the edges of the roster, not serving as the bulk of it.
This process takes time. The Mets are only now, seven years in, getting to the point where they are building a homegrown core. But the vision is clear and the Mets are starting to see the production there as well.
In 2026, the Mets youth led the charge, and in 2027, you would expect a full season from Juan Soto alone to increase the production from players in their prime. But this youth movement gives the Mets a good foundation to build upon as they continue to get younger.
| Age band | League average (WAR) | Mets (WAR) |
|---|---|---|
| Under 26 | 9.2 | 12.2 |
| 26-32 | 20.3 | 15.9 |
| 33+ | 3.8 | 2.5 |
| Total | 33.4 | 30.6 |