Last season, the New York Mets ranked in baseball’s top 10 in many offensive categories. They were second in batting average and on-base percentage, eighth in slugging percentage, sixth in OPS, fourth in OPS+, third-best in strikeouts and strikeout rate, sixth in wOBA, and third in wRC+.
How did such a team, returning many of the same batters, regress so drastically in 2023? The Mets are now in the bottom 10 in the league in many of those same offensive categories. Players like Pete Alonso, Francisco Lindor, Jeff McNeil, Starling Marte, Mark Canha, and Daniel Vogelbach, all prominent in the Mets’ 2022 success, are now contributing to their demise. How does so much change in one year?
While it’s hard to definitively answer that question, we’ve heard this song before. In 2021, the Mets fielded a lineup of players who suddenly and drastically underachieved, including Michael Conforto, Dominic Smith, Lindor, McNeil, and James McCann. Conforto, Lindor, and McNeil had several years worth of street cred built up as excellent hitters, and out of nowhere, they all tanked.
Let’s take a look at some of the Mets’ numbers this season and try to tease out what’s going on. Today, we’ll dig into the team’s overall hitting philosophy. Tomorrow, we’ll get into players’ individual struggles.
Swinging Philosophy
The Mets’ offensive philosophy is clearly to be very particular in choosing pitches to swing at. There’s a big push toward getting on base. In fact, Mark Canha recently said he’d like to be the player hit by the most pitches across baseball. That may well be a testimony to what his coaches are telling him.
Here are some of the numbers about the pitches the Mets choose to swing at. They definitely indicate the preference not to swing.
- Chase rate: 26.1% (T-6th)
- Zone swing rate: 64.4% (T-25th)
- Meatball swing rate: 73.6% (26th)
The Mets don’t chase very often, but that seems to be at the expense of swinging at pitches in the zone. The numbers get even worse when you consider meatballs. The exact definition of a meatball varies slightly from Baseball Savant to FanGraphs, but the idea is that it’s a ball with an extremely high expected batting average, average exit velocity, and expected slugging percentage. In other words, it’s exactly what has been referred to as a “meatball” in baseball vernacular throughout the years. The Mets simply do not seem to swing at meatballs. You won’t hit 100% of the balls you don’t swing at. Not swinging at pitches that are meant to be driven makes it harder on a team.
However, let’s compare these numbers to the Mets’ 2021-22 stats to see if there are any trends.
- Chase rate: 2022 – 29.5% (15th); 2021 – 29.7% (T-25th)
- Zone swing rate: 2022 – 68% (T-12th); 2021 – 71.2% (T-3rd)
- Meatball swing rate: 2022 – 76.3% (20th); 2021 – 81.4% (T-2nd)
What’s strange is that although the Mets did swing at a much higher rate of pitches in the zone in 2022, their swing rate in the zone was even higher in 2021. They also swung at meatballs at an extremely high rate in 2021 despite ranking poorly in most offensive categories. It doesn’t appear that the pitches they choose to swing at in and of themselves are causing the disparity.
One thing that is noteworthy, though, is that this clearly indicates the Mets’ shift in offensive philosophy toward being very selective even within the zone. It appears that Eric Chávez and then Jeremy Barnes preached choosing your pitches over just swinging at strikes. Although that philosophy appeared to help in 2022 compared to 2021, the shift even further down this season seems to be hurting the Mets. Perhaps 2022 was a sweet spot in the philosophy: try to be selective, but swing at more pitches in the zone.
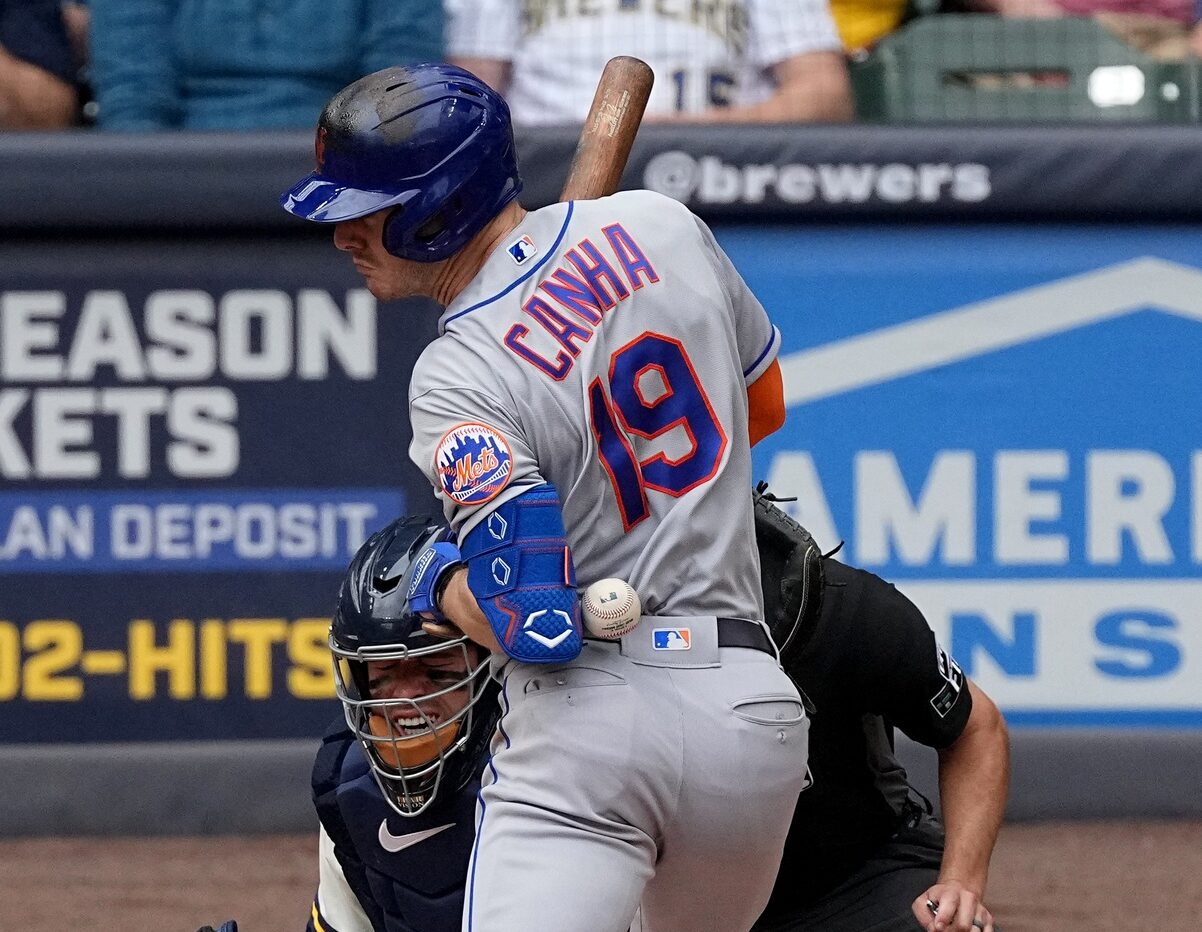
Mark Hoffman/Milwaukee Journal Sentinel-USA TODAY Sports
Making Contact
More important than the pitches the Mets choose to swing at is the quality of contact. What’s interesting is that in the last three seasons, the Mets have ranked similarly in hard-hit rate (20th, 21st, and 17th), barrel rate (22nd, 19th, 22nd), fly ball rate (21st, 20th, and 24th), groundball rate (10th-highest, 11th-highest, and 7th-highest) and weak contact rate (eighth-highest, 11th-highest, and 13th-highest). So why were they so successful in 2022 while struggling so much in 2021 and 2023?
This question is particularly perplexing when you consider that the Mets have a far higher average exit velocity (89.4, T-11th, vs. 18th/19th in 2021-22) and solid hit rate (6.5%, T-11th, vs. T-17th and 20th) than they did in the previous two seasons. They’re also making contact in the zone at the fifth-highest rate in baseball.
One number that sticks out, though, is the difference in the Mets’ line drive rates in 2021-23.
- 2021: 23.1% (19th)
- 2022 – 24.2% (9th)
- 2023 – 23.6% (17th)
It does appear that the Mets hit more line drives in 2022, which brought them better results. This season, those hits appear to be turning into popups, as the Mets pop up 6.8% in 2023, which ranks the 14th-highest, while they popped up 6.3% of the time in 2022, which was the sixth-lowest.
Still, could a 0.6% shift from line drives to popups really explain such a drastic shift in offensive output?
Lack of the Shift
It was a known fact that several Mets’ hitters, led by Jeff McNeil, murdered the shift (.423 BABIP against it). The Mets’ team BABIP has decreased from .300 in 2022, which ranked seventh in the league, to .275 in 2023, which ranks 26th. Could the shift limitations have something to do with it? (In 2021, they ranked 16th with a .291 BABIP.)
Consider that the Mets went to the opposite field 25.7% of the time in 2022, the sixth-highest rate in baseball. That kind of hitting is designed to beat the shift. In 2023, though, they haven’t adjusted their hitting style; they are going the opposite way 25.9% of the time, which ranks ninth. Combined with the fact that the Mets have a high groundball rate, perhaps a change in approach toward pulling the ball is warranted now that the shift is not there. This is particularly since the pull side is usually the power side for most hitters.
These are just some of the factors influencing the malaise of the Mets’ bats. Stay tuned for Part 2 tomorrow, where we take a look at specific pitches, other aspects of the problem, and whether there are any answers.


