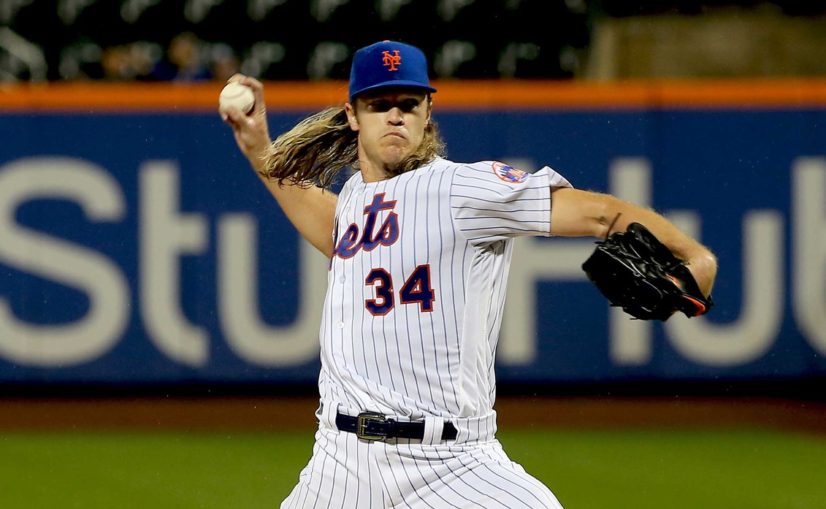
All the attention on the New York Mets’ starting rotation belongs to Jacob deGrom right now, who just became the 2018 National League Cy Young award winner, and did so in a landslide (rightly so). He’s certainly established himself as the ace of this talented staff, but there’s also another guy with the capability of pulling this award down one day: Noah Syndergaard.
After missing most of 2017 due to a torn lat muscle, Syndergaard’s overall statistics from this past season made it look like he didn’t miss a step. Through 154.1 innings, he produced a 13-4 record to go along with a 3.03 ERA, 3.55 SIERA, and 1.21 WHIP. Among starters with at least 150 frames, his 4.2 fWAR was one of the 20 best in baseball. While his 24.1% strikeout rate was a career-low mark, he paired a normal walk rate (6.1%) with incredible quality of contact numbers (25.3% soft-hit rate and 21.9% hard-hit rate).
One thing we’ve all gotten used to seeing from Thor is top-of-the-line velocity in all aspects, but mostly his fastball. It was more of the same this past year, as Luis Severino (97.6 miles per hour) was the only starting pitcher with 150-plus innings to have a higher average fastball velocity than Syndergaard (97.4 mph). An interesting trend that’s developed with his four-seamer in particular, though, is a consistent decline in strikeouts.
Here’s a look at how his strikeout rate, swinging-strike rate, OPS, and wRC+ against for this offering have changed from year to year (not including 2017 for obvious reasons).
| Year | K% | SwStr% | OPS | wRC+ |
|---|---|---|---|---|
| 2015 | 29.0% | 10.0% | .651 | 87 |
| 2016 | 25.8% | 9.1% | .698 | 97 |
| 2018 | 13.8% | 6.1% | .801 | 128 |
It’s worth noting that Syndergaard’s pitch mix has evolved over the years (his 53.6% overall fastball usage in 2018 was a career low), but it’s still his most frequently used weapon by a considerable margin.
An overall decline in strikeouts while still having a successful year is certainly a plus for Thor when thinking about his development as a pitcher. Many young hurlers with a blazing fastball like his are able to get away with mistakes simply by blowing opposing hitters away. A more even pitch mix in general — which was made possible due to decreased fastball usage — helped him find other ways to get hitters out with regularity.
The results can be seen in those quality of contact numbers shared at the top, both of which were among the best in baseball when looking specifically at starters. Having Syndergaard’s fastball numbers begin heading back in the opposite direction is important because there will be plenty of times throughout a season when he needs to lean on that pitch in crucial situations.
It seemed like almost every time deGrom needed to get a big out or generate a swing and miss, he went to his four-seamer in order to complete the job. The numbers don’t lie there, either — the opposition posted a 33.5% strikeout rate, 16.2% swinging-strike rate, and 62 wRC+ against deGrom’s fastball, which he threw at a 52.1% clip (also a career-low mark).
One has to hope Syndergaard’s quality of contact numbers are sustainable to a degree, mostly because it’s easy to see how much they stand out from the rest of his career (minus 2017).
| Year | IP | Soft% | Hard% |
|---|---|---|---|
| 2015 | 150.0 | 19.9% | 24.6% |
| 2016 | 183.2 | 21.0% | 28.1% |
| 2018 | 154.1 | 25.3% | 21.9% |
Judging from the changes he’s made with pitching coach Dave Eiland in his ear, it seems like there’s a good chance he’ll keep this up to some degree moving forward. If he can combine this improved skill with his ability to strike hitters out at or near a 30.0% rate (which he’s done in the past), the young right-hander can take the solid year he just had in 2018 and bring it to another level in 2019.
After seeing the incredible jump in production that deGrom just made, it’d be awfully fun to watch Thor find a way to reach new heights himself.


