Photo by Ed Delany/MMO
Fan Shot By Daniel Marti
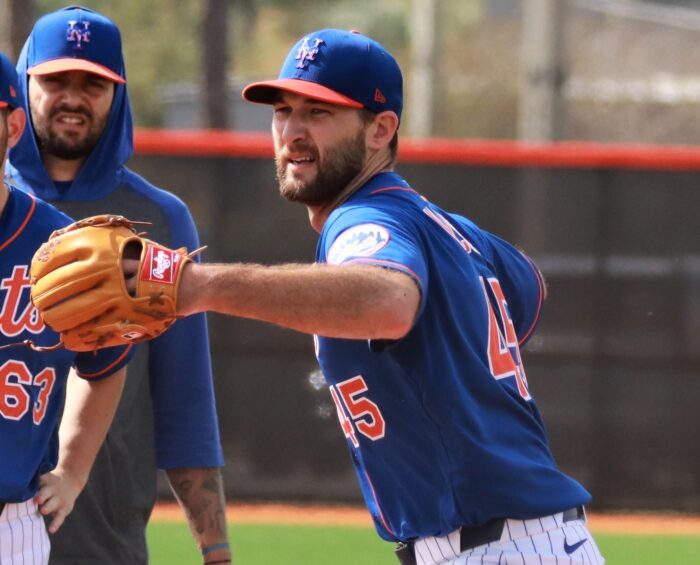
The New York Mets have amplified the starting rotation depth this winter with the major-league signings of Rick Porcello and Michael Wacha. Wacha presents quite the curious case to the Mets as his star has seemingly faded at age 28. Early projections have Wacha slated for a long-relief role in the Mets’ bullpen while also being the first in line to start games when injuries inevitably occur. While there is no denying that his 2019 was absolutely terrible, there is reason to believe that with the right adjustments Wacha can prove to be one of the best value signings the Mets have made this offseason.
Let’s take a brief look at Wacha’s career. Wacha burst onto the scene at age 21 in 2013 for the St. Louis Cardinals. He played a key role in their World Series run by pitching masterfully in the playoffs, posting a 2.64 ERA and 0.91 WHIP in 30.2 innings. He proceeded to yield mixed results for the next few seasons, pitching well for stretches while also battling nagging shoulder injuries.
In 2017, Wacha was finally healthy and had his best season – pitching to a 4.13 ERA and 3.63 FIP in 165.2 innings. Wacha’s 2018 was cut short due to a left oblique strain and 2019 was the worst season of his career. In 2019, Wacha posted a 4.76 ERA, 5.61 FIP and 1.56 WHIP in 126.2 total innings. He eventually lost his spot in the Cardinals’ rotation and made appearances out of the bullpen, where he was still hammered to the tune of a 5.68 ERA, 6.37 FIP and 1.82 WHIP in a limited sample of 12.2 innings.
The Mets would clearly benefit from having the 2017 Wacha as his production that season would lengthen the latter half of the rotation along with Marcus Stroman and Steven Matz. With this in mind, we as Mets fans must ask the following questions:
- What changed in 2019 to cause Wacha’s horrific performance?
- What adjustments can Wacha make to return to his peak form or at least to maximize his contributions to the Mets in 2020?
Fall from Grace
In order to understand what happened to Wacha in 2019, we must first look at what happened in 2018. On the surface, it looks like everything was fine for Wacha in 2018 as he posted a 3.20 ERA, 4.22 FIP, and 1.23 WHIP in 84.1 innings before missing the remainder of the season due to his oblique strain.
However, Wacha’s peripheral statistics in 2018 indicate that he was one of the luckiest pitchers in the league that year as he put up a paltry .249 BABIP (the league-average BABIP in 2018 was .291) while his line-drive rate was 29.5% (the league-average line drive rate in 2018 was 21.6%). The most telling sign of his impending collapse was his alarming .350 xWOBA and .399 xWOBACON in 2018. Basically, this means that hitters were making much better contact against Wacha while not reaping a proportional level of results in games.
The wheels completely came off for Wacha in 2019. His BABIP climbed up to league-average levels, hitters improved to a .354 xWOBA and .403 xWOBACON, and his HR/FB ratio spiked to 21%. Now that we can see that Wacha’s demise actually began in 2018, we still need to figure out what caused hitters to be able to tee-off on him the way they did. Let’s take a closer look at Wacha’s pitch repertoire to see if any red flags can be identified.
Michael Wacha primarily uses 4 pitches: Four-seam fastball, Changeup, Cutter, and Curve. Like most pitchers, the fastball is his most frequently used pitch which in turn sets up his other pitches. In 2017, Wacha’s fastball averaged approximately 95 MPH while touching 98-99 MPH at its peak velocity. That same year, Wacha varied the location of his fastball and threw outside to right-handers for strikes.
Though not a high-volume strikeout pitcher, Wacha posted a 25% K rate with a stingy 5.9% BB rate against righties in 2017, largely due to his precise command of the fastball.
Wacha’s fastball lost velocity after 2017 as it averaged 93.6 MPH in 2018 and 93.0 MPH in 2019. Wacha also appeared to have lost command of his fastball as it transitioned to living in the heart of the plate. A slower fastball located in the middle of the plate is a hitter’s dream. Let’s compare how Wacha located his fastball from 2017 to 2019:
Michael Wacha Fastball Heatmap – 2017:
Michael Wacha Fastball Heatmap – 2018:
Michael Wacha Fastball Heatmap – 2019:
The 2017 heatmap illustrates how Wacha was able to locate his fastball on the opposite sides of the zone with consistency. The variations in location may appear to be subtle, but they are significant in Wacha’s ability to retire batters. In 2018, we can see that the fastball location was largely concentrated in the middle of the zone. In 2019, Wacha’s fastball was located slightly lower in the zone but it still caught too much plate with little variation in placement. The results demonstrate what happens when slower fastballs live in the same area of zone without enough variation in location:
| Year | Pitch | Pitch % | SwStr% | Contact% | WOBA | xWOBA |
| 2017 | 4-Seamer | 49.60% | 7.50% | 84.30% | 0.351 | 0.340 |
| 2018 | 4-Seamer | 42.40% | 6.30% | 85.80% | 0.341 | 0.402 |
| 2019 | 4-Seamer | 49.50% | 5.20% | 89.50% | 0.408 | 0.399 |
None of these trends are good ones. Wacha’s most heavily-used pitch missed fewer bats and the damage done against it rose dramatically.
Another notable change that hurt Wacha was the deterioration of his curve after 2017. Though only used 11.5% of the time in 2017, Wacha’s curve yielded a phenomenal .183 WOBA and .128 xWOBA against opposing hitters. This pitch also averaged 3.6 inches of vertical movement which was better than the average MLB curveball in 2017. Wacha’s curve kept hitters honest and was practically a secret weapon until it lost all its effectiveness the following year.
The curve’s average vertical movement dropped to 1.6 inches in 2018 and then to -0.8 inches in 2019 (this is far below the MLB average). Along with the loss of movement came the loss of command as Wacha could no longer locate his curve at the bottom of the zone with consistency. Just as we did with the fastball, let’s take a glance at how Wacha located his curve in the past three seasons:
Michael Wacha Curve Heatmap – 2017:
Michael Wacha Curve Heatmap – 2018:
Michael Wacha Curve Heatmap – 2019:
We can see that Wacha was able to locate his curve at the upper and bottom halves of the zone with great consistency in 2017. Hitters did not like to swing at this pitch despite the fact that Wacha could throw it for strikes. When they did swing, they could not do much with it. Wacha could’ve possibly been even more effective in 2017 if he featured his curve more instead of his mediocre cutter.
Similar to his fastball, Wacha lost the ability to command his curve in 2018. His 2018 curve heatmap shows that Wacha transitioned more to the heart of plate. It appears that more of his curves were being hung in the zone, supported by the decrease in vertical movement, thus allowing batters to hit them with greater authority to the tune of a .365 xWOBA and an improved 23.1% line-drive rate.
Wacha’s curve became a batting practice pitch in 2019 as hitters posted a .549 WOBA, .426 xWOBA, and a devastating 31.3% line-drive rate against it. Though his curve found the bottom of the zone more in 2019 than the previous year, it was largely thrown for balls. This along with a further decrease in vertical movement failed to fool hitters and allowed them to become more disciplined against Wacha’s curve. Their swing rates dropped across the board while their contact rates inside the zone spiked to 93.8%. Let’s take a look at 3-year trends for Wacha’s curve:
| Season | Pitch | Pitch Percentage | LD% | SwStr% | Swing% | Z-Contact% | WOBA | xWOBA |
| 2017 | Curve | 11.50% | 15.80% | 8.50% | 29.30% | 91.70% | 0.183 | 0.128 |
| 2018 | Curve | 15.00% | 23.10% | 5.70% | 26.90% | 90.90% | 0.264 | 0.365 |
| 2019 | Curve | 10.30% | 31.30% | 5.30% | 18.10% | 93.80% | 0.549 | 0.426 |
To make a long story short, Wacha lost velocity on his fastball and the ability to locate his pitches with the same level of precision as he did in 2017. Since Wacha is not a prototypical strikeout pitcher, his pitches have a much lower margin for error. If his pitches do not meet their spots, there is a good chance they will be crushed as they don’t have enough movement or velocity to overpower major-league hitters.
Hope for the Future
Though odds may be stacked against Wacha from returning to his former glory in St. Louis, he does have the ability to recover from the past two seasons of futility. The primary factors in Wacha’s favor are his age, his changeup, and the option to transition into a relief pitcher.
Michael Wacha will turn 29 in July 2020. By all accounts, he is a still a young man through the lens of a pitcher as many of his peers have found their footing in their late-twenties and early-thirties. Examples of such pitchers who broke-out at older ages include Mike Clevinger, Patrick Corbin, Sonny Gray, and many more.
Due to his age, Wacha still has the ability to regain velocity on his fastball. His fastball will be less susceptible to damage if he can add 1 or 2 MPH back on it. Though this is easier said than done, look no further than to another former Cardinals pitcher, Lance Lynn, for an example of an older pitcher who added velocity to his fastball. At age 32, Lynn was able to improve his average fastball velocity from 93.7 MPH in 2018 to 94.6 MPH in 2019.
Along with improved velocity, there is no reason to believe that Wacha cannot regain the ability to locate his fastball and secondary pitches with the same levels of precision as he did in 2017. This especially applies to his curve, as this pitch tormented hitters in the past. If Wacha can locate the corners with his fastball and throw his curve at the bottom half of the zone for strikes, both pitches can return to their former glory.
Another reason for optimism is that all throughout his struggles in 2018 and 2019, Wacha’s changeup remained a plus pitch. As a matter of fact, it improved each year from 2017, culminating in the 2019 season when it rendered hitters to a measly .250 WOBA and .243 xWOBA. If Wacha can regain his fastball, his changeup will only be tougher for hitters to handle.
The option to become a reliever can also serve Wacha quite well. Though he pitched poorly out of the bullpen 2019, we can ignore it due it being such a small sample. By focusing on solely pitching one or two innings at a time, Wacha can maximize the velocity of his fastball organically. He topped out his fastball at 97 MPH in 2019. A 97 MPH heater could serve to be a deadly pairing with his changeup. There is good reason to be confident in Wacha becoming a potent reliever if he can’t succeed as a starter.
Michael Wacha is a volatile pitcher who can reemerge as a quality mid-rotation starter, become an effective reliever, or continue his descent into baseball irrelevance if he fails to command his fastball. Unfortunately, Wacha doesn’t have the type of “stuff” that can bail him out when his pitches don’t hit their spots. However, given his maturity, experience, pedigree, and talent, Wacha is one of the more underrated arms to keep an eye on this season. For a 1-year $3 million contract, the risk Michael Wacha presents is certainly worth the reward to the New York Mets in 2020.
* * * * * * *
This Fan Shot was contributed by diehard Mets fan Daniel Marti.
Have something you want to say about the Mets? Share your opinions with over 25,000 Met fans who read this site daily. Send your Fan Shot to [email protected].


