During last night’s SNY broadcast, SNY showed Matt Harvey’s opposing batting average broken down by number of times through the opposing team’s lineup:
First time through the lineup: .243
Second time through the lineup: .284
Third time through the lineup: .510
This pattern continued last night as the Washington Nationals hit two home runs their second time through the lineup and three additional runs the third time through the lineup knocking Harvey out after five innings.
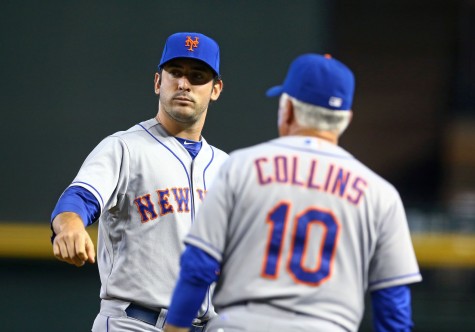
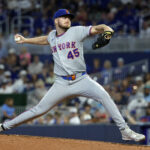
Matt Harvey
During SNY’s broadcast, Ron Darling explained a mechanical flaw seen in Harvey’s throwing motion. In 2015, after Harvey broke his pitching hand from his glove to begin his windup, Harvey had his forearm, wrist and hand all in a straight line toward the ground and eventually point back at second base as his pitching arm continued the windup. In 2016, as Harvey breaks his throwing hand from his glove and begins his arm swing/arm motion, Harvey cup’s or curls his throwing wrist back toward first base.
This wrist curl is an excess or unnecessary movement. The more unnecessary movements in Harvey’s throwing arm and hand, the higher level of difficulty for Harvey to repeat or gain a consistent release point. Release point is the main dictator of pitch command, velocity and movement.
As Darling noted in the broadcast, this is a bad habit Harvey gained at some point during the off-season or spring training. Generally, pitchers mechanical bad habits tend to get worse during the course of a game as a pitchers focus diverts further into the game and their body tires making it difficult to adjustment a bad habit in the middle of a game.
During last night’s fourth and fifth inning, eighteen of Harvey’s thirty-eight pitches were poorly commanded either belt-high or down the middle third of home plate. Additionally, Harvey’s fastball velocity decreased from consistently throwing 95 to 96 mph in the first inning to 92 to 94 mph by the fifth inning.
Stat of the Night
Last season, Harvey’s ERA during the first seventy-five pitches of a game was 2.86 compared with a 2.23 ERA during pitch seventy-six and beyond meaning Harvey improved as games progressed.
In 2016, Harvey’s ERA during the first seventy-five pitches of a game is 5.04 compared with an 11.42 ERA during pitch seventy-six and beyond.
Follow Chris Zaccherio on Twitter @ziography for more Mets insight going beyond statistics.


