There were a lot of statistics that added up to give the Mets their second straight 74-88 record in 2013. Here are some of the more notable, some good, some bad and some down right ugly. I am sure there are more and would love to hear your suggestions:
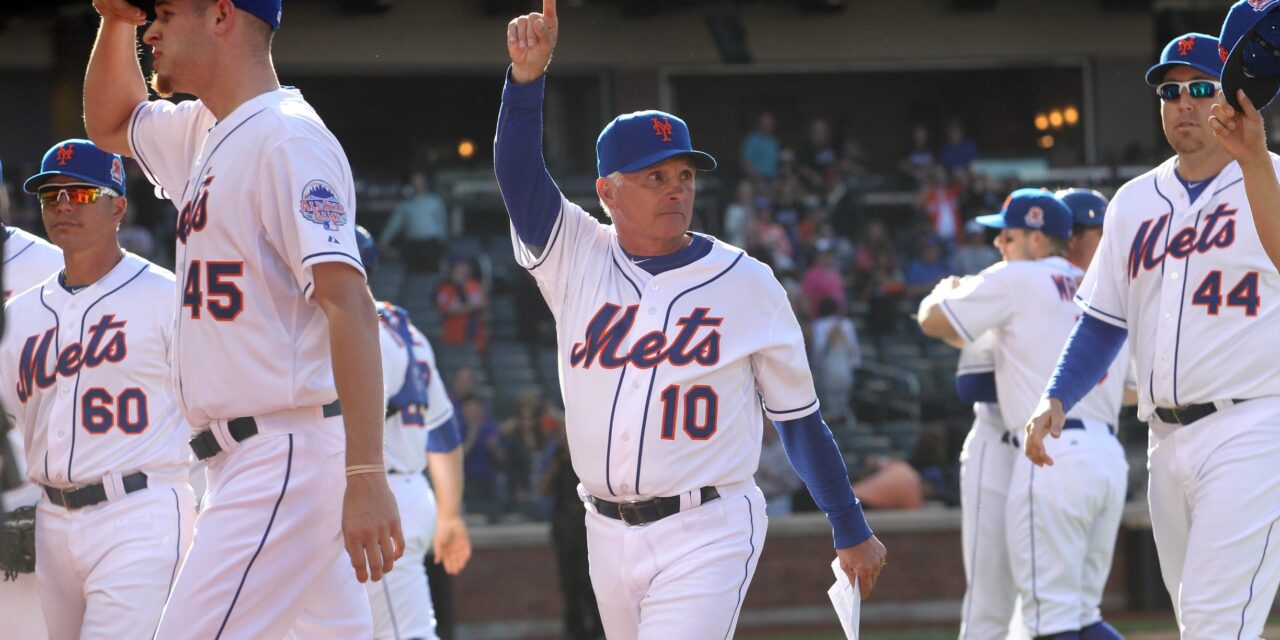
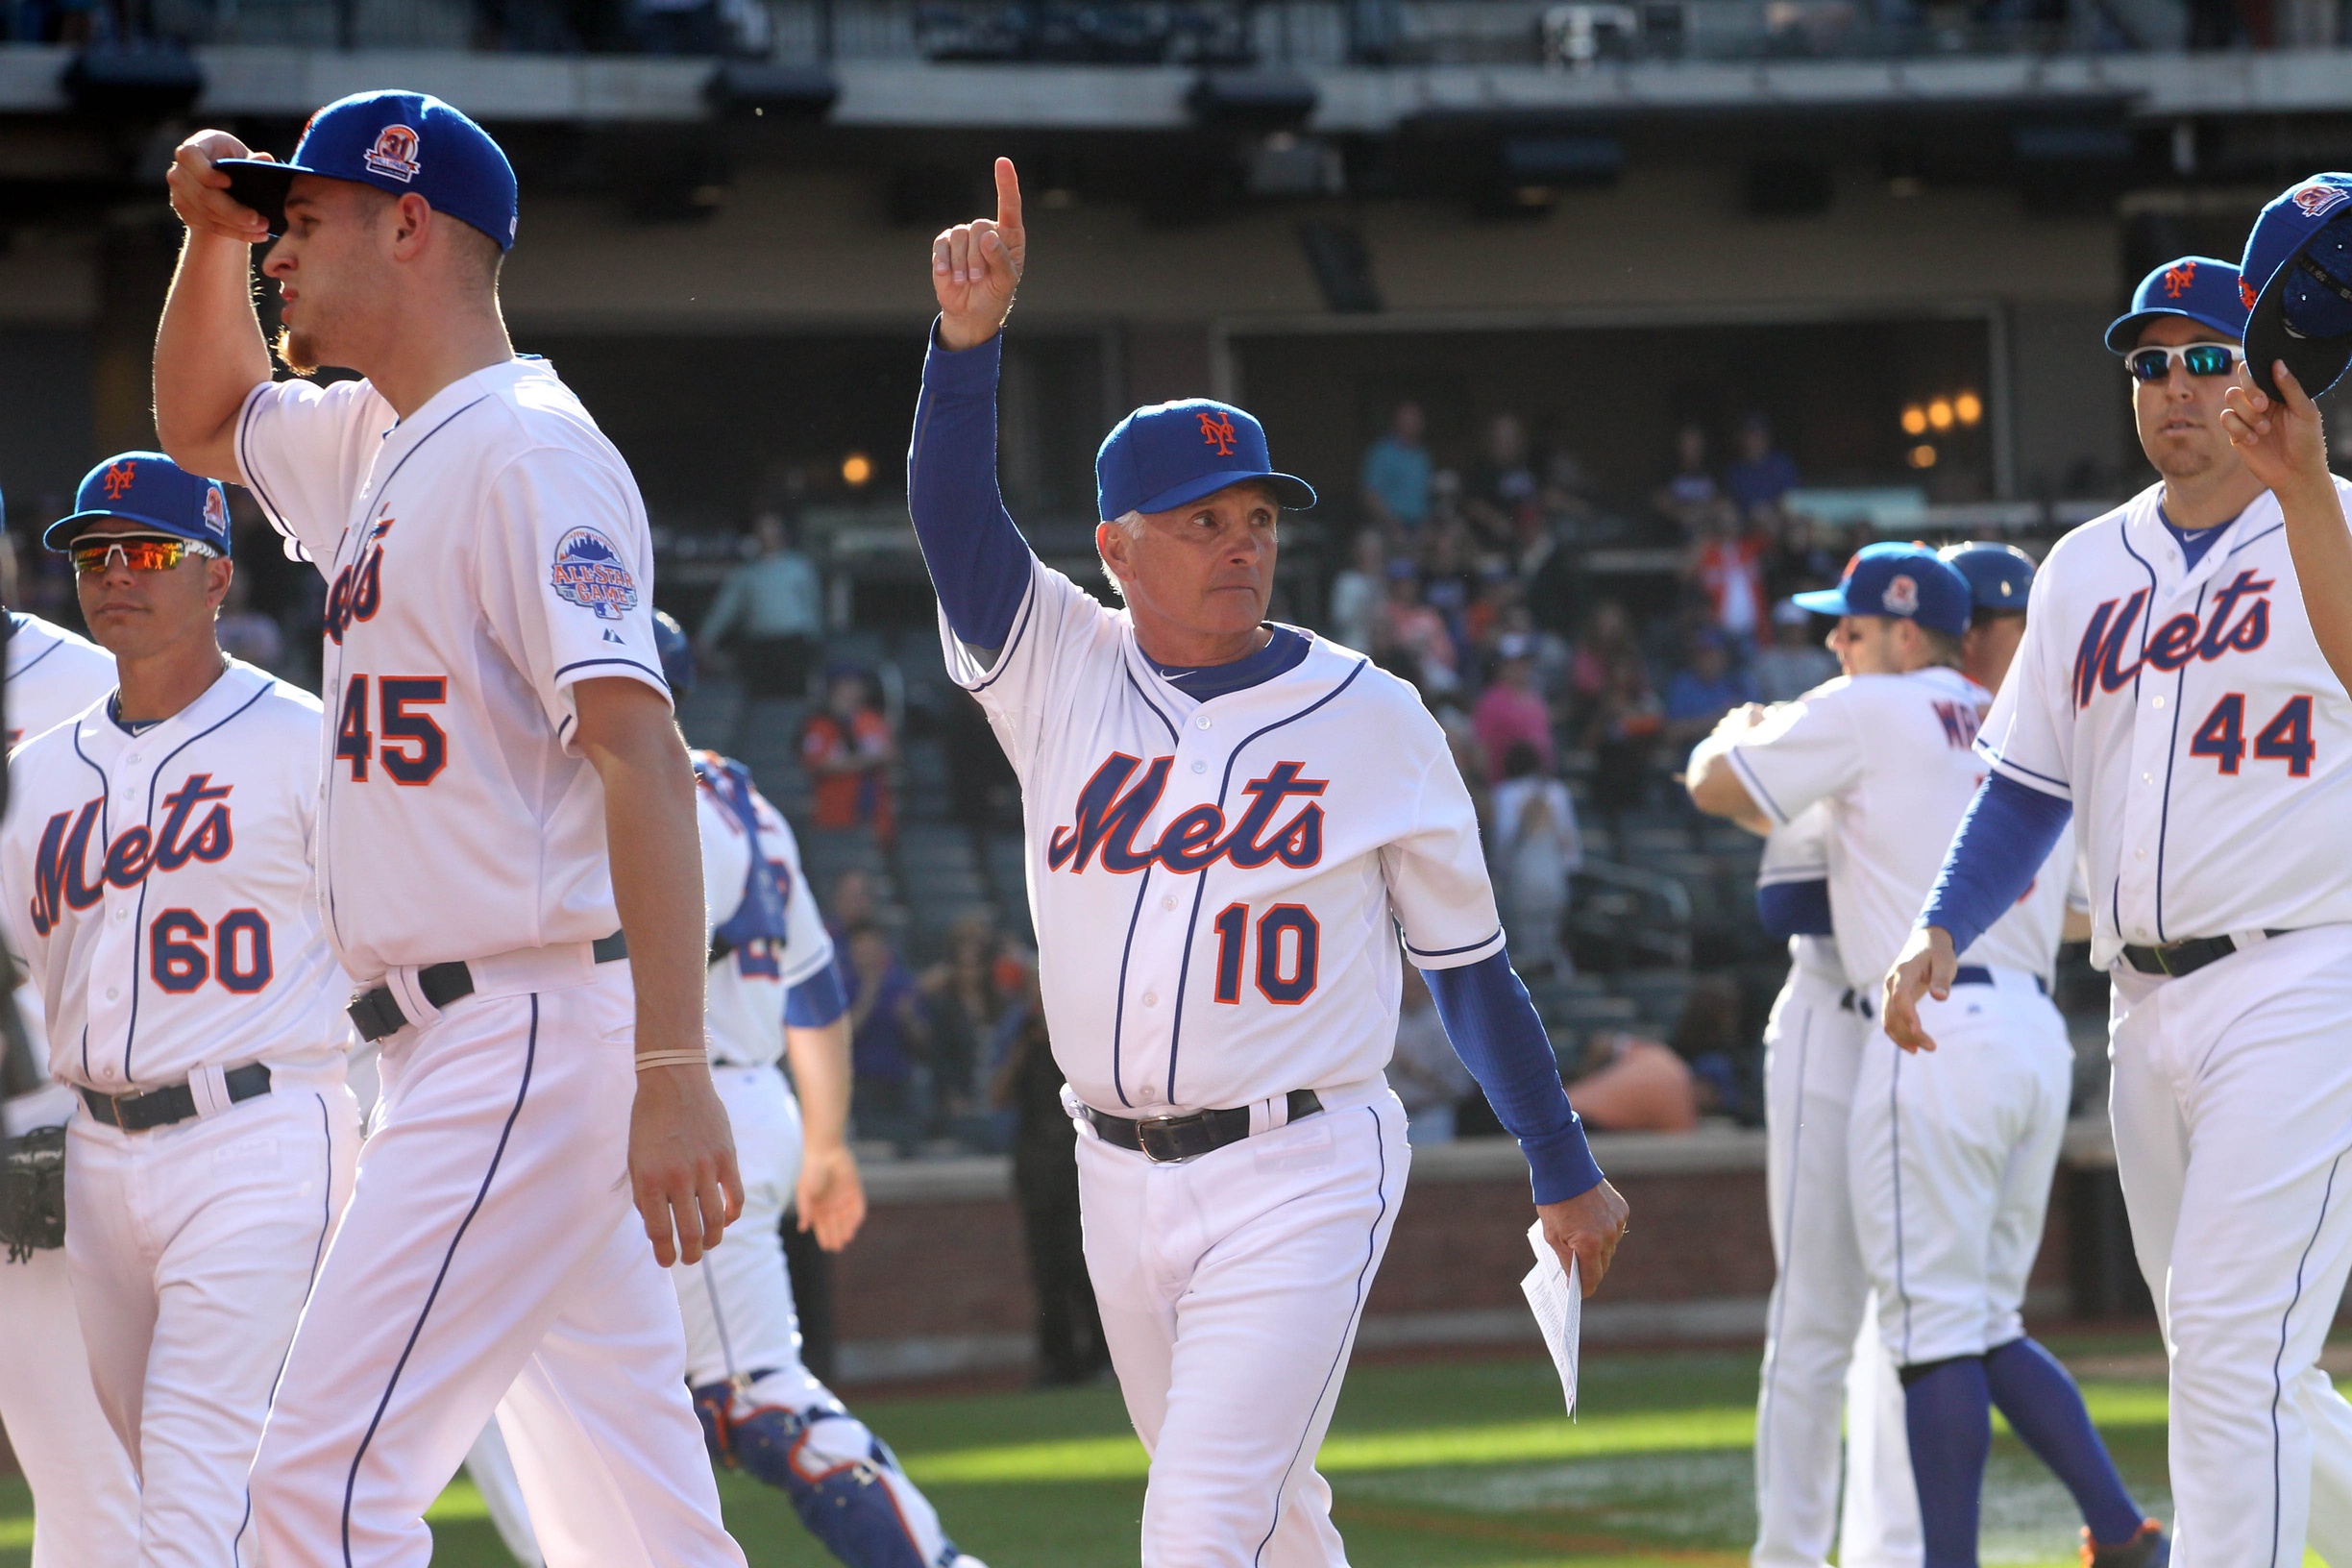
1: The number of fingers Terry Collins held up when the Mets walked off the field on the last day of the 2013 season.
2: Home games sold out.
2-4: Matt Harvey’s record after 7-1 start.
4: Grand slams by Mets hitters, none who were with the team at the end of the season (John Buck, Marlon Byrd, Collin Cowgill and Jordany Valdespin).
4: National League teams Mets had winning records against (Arizona, Philadelphia, San Diego and San Francisco).
7-15-5: Record in home series.
7: Number of hitting streaks of 10 or more by hitters Mets’ hitters, led by Daniel Murphy, who had three.
8: Walk-off hits by David Wright to lead team.
8: Mets hitters who struck out at least 70 times, including three – Byrd, Lucas Duda and Ike Davis – with over 100.
8: Games pitched in by Frank Francisco, who made $6.5 million.
8-8: Jon Niese record, a drop of five victories from a career high 13 in 2012.
9: Homers by Davis, 23 fewer than in 2012.
9-12: Record in extra-inning games. Successful teams win these types of games. Overall, the Mets played 57 extra innings, the equivalent of just over six extra games.
10: Different hitters used in the leadoff spot, a void filled by Eric Young.
11-61: Record when trailing after six innings.
11-9: Interleague record, including 4-0 vs. Yankees.
12: No decisions in games started by Harvey.
13: Different pitchers used to start a game.
14-25: Record vs. NL playoff teams.
15-12: Record in July, their only month with a winning record.
15: Outfield assists by Juan Lagares, most by a rookie and tied for third in the majors.
15: Different hitters used in the sixth spot in the order.
18: Different hitters used in the seventh spot in the order.
18: Home runs by Wright to lead the team (Byrd had 21 before he was traded to Pittsburgh).
20: Quality starts by Harvey.
22-73: Record when bullpen gives up a run.
25: Percentage of potential base stealers thrown out by Mets catchers.
26: Victories by the bullpen.
26-59: Record when opponents scored first.
29-28: Record in one-run games.
31: Come-from-behind victories. This is after trailing at any point in the game.
33-48: Record at home.
34: Two-out RBI by Murphy, most on the team.
34-42: Record vs. National League East. (9-10 vs. Atlanta; 8-11 vs. Miami; 10-9 vs. Philadelphia; 7-12 vs. Washington).
46: Stolen bases by Young to lead National League.
55-38: Record when getting a quality start.
112: Games played by Wright.
130: Mets homers; opponents hit 152.
131: Different lineups used.
.147: Duda average with runners in scoring position.
188: Hits by Murphy, second in the National League.
.242: Mets’ average with runners in scoring position. The Mets had close to 3,000 runners in scoring position and only 441 of them scored. Mets’ hitters struck out 315 times in this situation and grounded into 26 double plays.
.265: Opponent’s average with runners in scoring position. Opponent’s scored 529 runs in this situation, aided greatly by 35 home runs.
.306: Team on-base percentage, 25th in the majors.
504: Innings pitched by the bullpen, just over three a game.
619: Runs scored, 684 runs allowed for a -65 run differential.
1,384: Strikeouts by Mets hitters, most in the National League, which is the equivalent of 51 games played without hitting a ball other than a foul.
2,135,657: Total attendance, their lowest since drawing 1.77 in 1997 at Shea Stadium.


