An MMO Fan Shot by @kengiffyjr
Everyone knows Bullpens are extremely important. But I set out to determine HOW important, and whether there was any correlation between a team’s Bullpen WAR and the overall team’s wins. This offseason Brodie had a tall task, improving the offense, its depth, and more. But one of the boxes he needed to check on the top of his To Do list from the get go – completely revamping this bullpen after their horrible 2017/2018 campaigns. Now that the dust has settled and the main pieces of the pen is seemingly locked, let’s dig in.
First, let’s tackle that “importance” question. The chart below contains all Bullpen Performances for every team over the last 4 seasons. The plot points that are labeled are the 40 teams that made the playoffs. As I dug in, an interesting pattern started to develop…case in point, here’s the average Bullpen WARs and the average Team Wins across the 2015-2018 seasons:
Over 5.0 Bullpen WAR = 90 wins
4.0 – 5.0 = 85 wins
3.0 – 4.0 = 83 wins
2.0 – 3.0 = 76 wins
1.0 – 2.0 = 74 wins
Under 1.0 = 72 wins
Now there were certainly outliers here and there, i.e. teams that had well above average bullpens but were seemingly really poor everywhere else that their team wins were still low, like the 2018 Padres (8.7 WAR but just 66 Wins.) On the other end of the spectrum, there were also a few teams like the 2018 Indians that had an unusually low Pen performance but were so strong elsewhere (0.4 WAR but 91 Wins.) But those outliers were few and far between, and the pattern started to get more and more interesting.
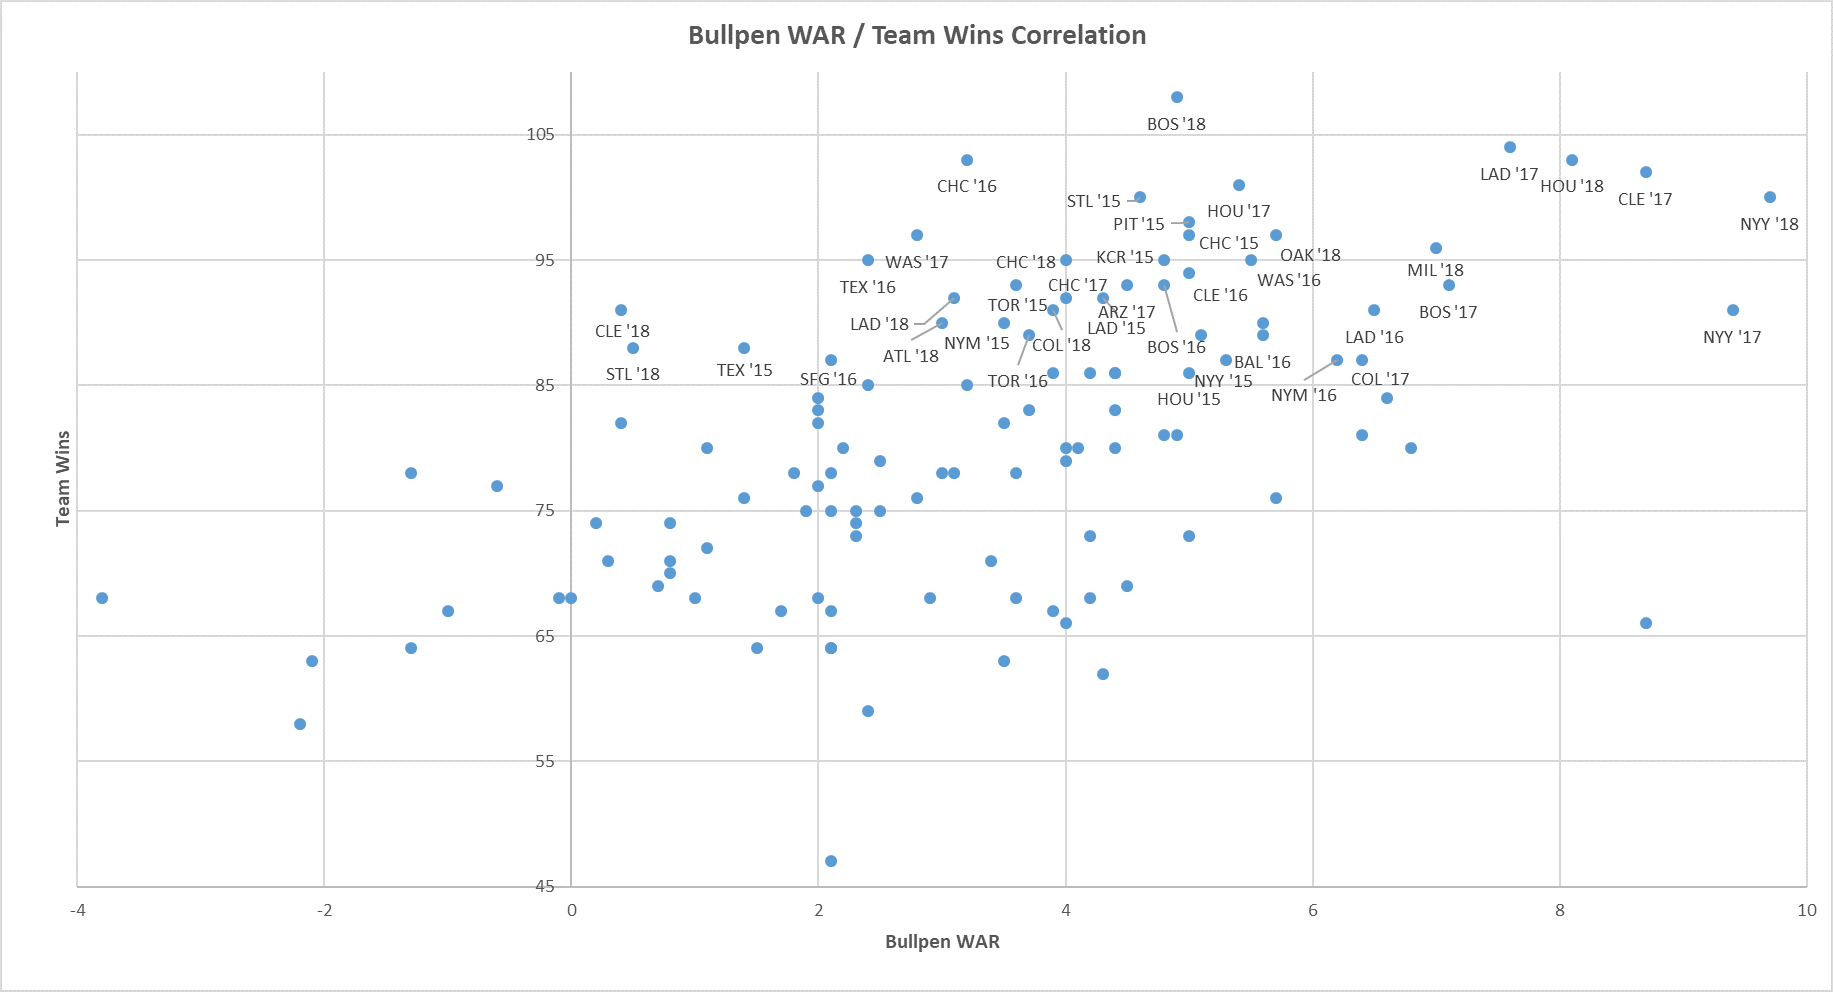
Some notable stats from the chart as we try to find that magic bullpen WAR number:
Over the past 4 seasons:
- Only 3 teams out of 40 had a Team Bullpen WAR under 2.0 and made the playoffs.
- If your bullpen had a WAR of 3.0 and above, you made the playoffs 50% of the time.
- If your bullpen had a WAR of 4.0 and above, you made the playoffs 54% of the time.
- If your bullpen had a WAR of 4.5 and above, you made the playoffs 69% of the time.
So before we dig into the 2019 Pen and what’s needed for each member, let’s take a look back:
Mets Bullpen Usage and WAR from 2015–2018
Mets 2015 – 3.5 BULLPEN WAR (13th in MLB), 90 TEAM WINS, 455 BULLPEN INNINGS PITCHED
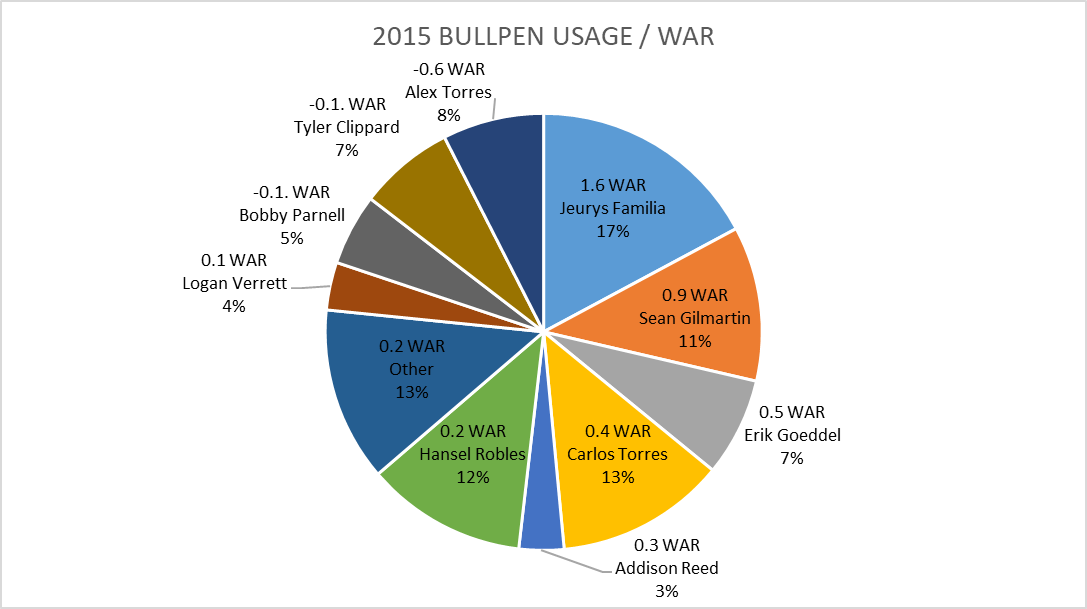
2015 Toplines
Positives:
- Familia stepped into the closer run and ran with it, pitching a dominant 78 innings.
- Between Gilmartin, Goeddel, Carlos Torres, Robles and Other (comprising of 5+ relievers that pitched under 10 IP) they had a solid 2.2 WAR and accounted for 56% of the relief innings pitched.
Negatives:
- 20% of Innings pitched (Alex Torres, Tyler Clippard and Bobby Parnell) had a negative WAR, -0.4 WAR average.
- Only one reliever with a 1.0 WAR and above.
Mets 2016 – 6.2 BULLPEN WAR (4t in MLB), 87 TEAM WINS, 520 BULLPEN INNINGS PITCHED
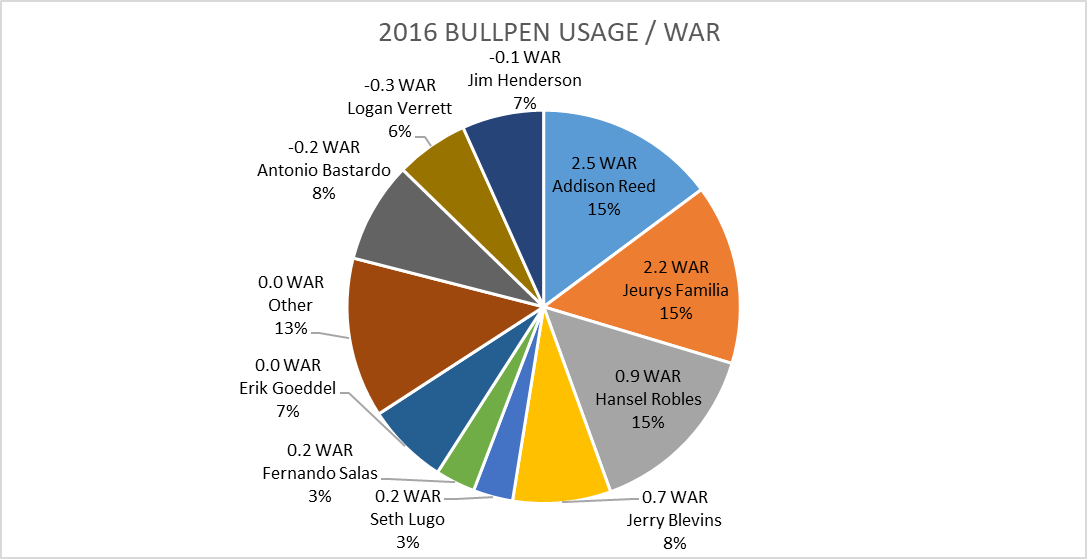
2016 Toplines
Positives:
- 45% of the usage came from Reed, Familia and Robles, which had a whopping 5.6 WAR total.
- The Mets were 1 of only 2 teams with 2 relievers above the 2.0 WAR mark.
Negatives:
- 21% of usage with negative WAR (Bastardo, Verrett, Henderson), but just -0.2 average.
Mets 2017 – 0.8 BULLPEN WAR (28th in MLB), 70 TEAM WINS, 565 BULLPEN INNINGS PITCHED
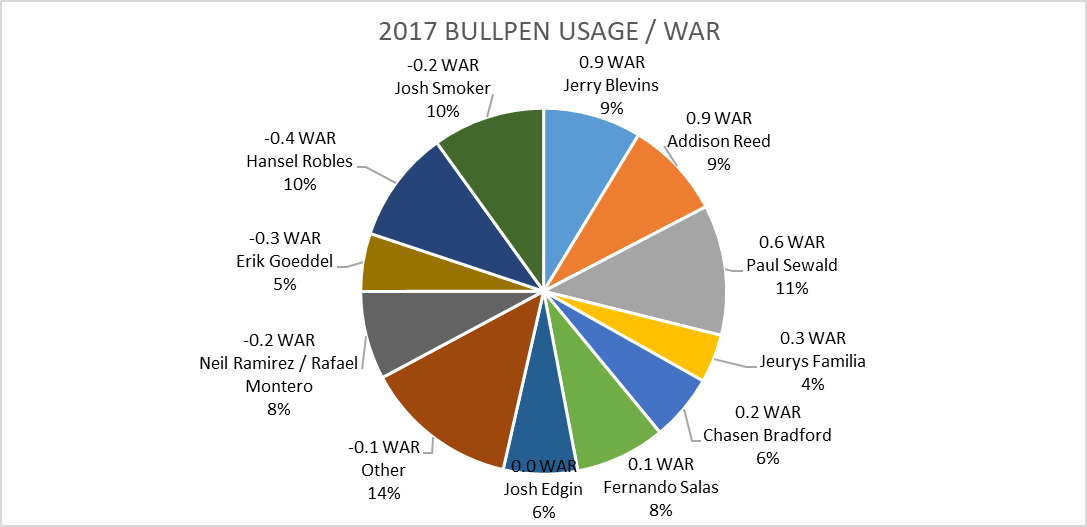
2017 Toplines
Positives:
- Blevins and Reed each were near the 1.0 WAR mark while pitching under 50 innings.
Negatives:
- The reliever that pitched the most innings in 2017 was Paul Sewald (he was actually decent though with 0.6 WAR.)
- Familia only pitched 24.2 innings (injury)
- Robles went south and was awful (-0.4 WAR across 56.2 innings.)
- Nearly 50% of the IP had a negative WAR.
Mets 2018 – NEGATIVE 0.6 BULLPEN WAR (28th in MLB), 77 TEAM WINS, 547 BULLPEN INNINGS PITCHED
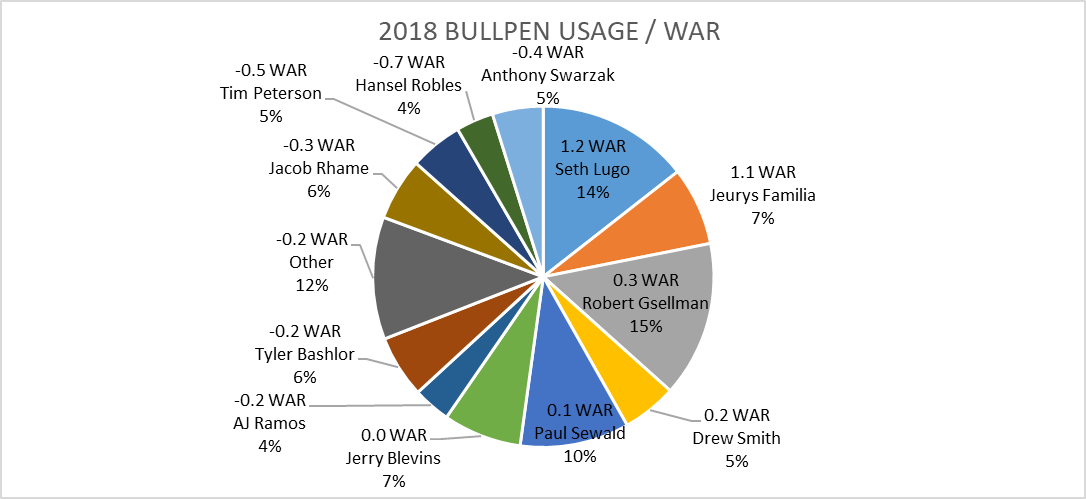
2018 Toplines
Positives:
- Seth Lugo.
- Familia had another stellar 1.1 WAR across only 40 innings.
- Gsellman was a workhorse (80 IP) but amassed just a 0.3 WAR.
- Some newcomers (namely Drew Smith and Bashlor to a degree) showed promise.
Negatives:
- Hansel Robles, Anthony Swarzak, and AJ Ramos had a negative 1.3 WAR between the three of them. Yikes.
- Blevins regressed from his strong 2017.
- Newcomers Rhame and Peterson were not good (-0.8 WAR between the two.)
- Once again over 50% of the IP had a negative WAR.
2019 Outlook
So let’s use that 4.5 Bullpen WAR magic number. The one where if you achieved that number over the past 4 seasons you made the playoffs 69% of the time. Let’s look at the keys to get there for each key piece of the bullpen. Two quick notes: One, WAR for relievers includes a leverage component so the closers/late inning relievers are going to be impacted accordingly for that higher Leverage Index. And Two, health is obviously the biggest component, which is not factored into the outlook/forecast below.
- Edwin Diaz – Over the last 3 season with the Mariners, he’s averaged 64 innings pitched and a 2.1 WAR per season. 1 assumes he regresses a little from his 3.5 (!) historic season last year. Projections are also pegging him at 2.1, so let’s go with that number – 65 innings, 2.1 WAR.
- Jeurys Familia – His WAR will be impacted by his new setup role. Over his last 3 full seasons (taking out 2017), he’s logged an average of 76 IP. Projections have him at a solid but not outstanding 1.0 WAR. Remember that Addison Reed netted a 2.5 in 2016 and 0.9 (in only 49 innings) in 2017 in the setup role. I’m going to bump him up a little – 70 innings, 1.3 WAR.
- Seth Lugo – Had a 1.2 WAR for just his reliever role last year where he pitched 78 innings in relief. Don’t think they’ll use him as much, and his Leverage Index may dip a little as he’s used in a variety of situations. Projections have him at only 0.4 (in 60 IP), which is conservative. I’m going with – 70 innings, 0.7 WAR.
- Justin Wilson – Recently signed Wilson is more than just a LOOGY. Over the past 3 seasons he’s averaged 56 IP and a 0.9 WAR, with last year being his worst at a 0.5. Projections have him at only 40 IP and a 0.3. I think Mickey should use him more often than these projections – 55 IP, 0.5 WAR.
- Robert Gsellman – Gsellman is the toughest to predict due to his up and down 2018. He was used all over the bullpen last year since he was one of the only two serviceable guys for a while. Based on his splits he thrived more in high leverage situations (FIP was a 3.25 in these situations vs. 4.21 in low/medium) which makes the idea of using him and Wilson in the 7th based on matchups a good plan on paper. Projections have him at a 0.2 across 60 innings. He likely won’t get to the 80 IP like last year – 65 innings, 0.2 WAR.
- Luis Avilan/Daniel Zamora – This second lefty role will be more of a LOOGY. Over the last 3 years, Avilan has averaged a 0.7 WAR across an average of 37 innings. Zamora was solid last year across 9 IP (0.2 WAR.) Projections for guys who pitch less than 40 IP are always low (Fangraphs has them both at a 0.0.) Based on past performance and the fact that this will be a healthy competition to see who wins the job (and thus have some depth in case one falters), I’ll peg them at – 35 innings, 0.3 WAR.
- The Rest – Let’s tally up the IP above and the average amount of Bullpen IP across the last 4 years. 360 IP for the above 6/7. Previous 4-year average was 522. So that’s still 160 IP unaccounted for. Which makes Bullpen depth perhaps one of the most important pieces of all. And their depth is decent – between young guys like Smith, Bashlor and Ryder Ryan (and possibly Villines soon) and new pickups Dowdy, Lockett and Santiago, the Mets will be able to play around with some options. Some of these guys will certainly produce a negative WAR (especially since a lot of this will be low leverage mop up and long man duty), but if Mickey can use them wisely and they can avoid overusing the really bad performers (like Alex Torres in 2015 and Robles and Swarzak in 2018), it can go a long way. Let’s go 160 innings (30% of usage), negative 0.1 WAR.
FINAL TALLY: 522 INNINGS, 5.0 WAR.
* * * * * * * * *
This Fan Shot was contributed by MMO community member and die-hard Mets fan @kengiffyjr. Have something you want to say about the Mets? Send your article to [email protected] or use this Contact Form. Or ask us about becoming a regular contributor.


