My colleague, Connor O’Brien, did a series of getting to know your sabermetrics statistics in 2016. I wanted to continue his efforts to bring more stats to you that many baseball front offices believe are important in player evaluation.
The one we will discuss today is expected weighted on base average or xwOBA. Weighted on base average (wOBA) gives hitters credit for the types of ways that they reach base. The biggest complaint with OBP is that it doesn’t measure the fact that hits are better than walks. Which is absolutely true, hence, we have wOBA. wOBA does what batting average doesn’t, it includes walks and it gives hitters more credit for hitting home runs or doubles.
For example, if hitter A went 2-for-4 with two singles, hitter B went 0-for-2 with two walks, and hitter C went 2-for-4 with two homers, then who had the best day? Well the answer should be easy, it was hitter C because a home run is always the best outcome. Here’s the issue: they all had the same OBP and both hitters A and C had the same batting average. So there itself is wOBA’s value, it gives proper weight to hits unlike batting average or OBP. I linked Connor’s explanation of wOBA if you want a more detailed explanation of the statistic.
Expected wOBA measures the players luck when it comes to his wOBA. It uses exit velocity and launch angles in its calculation to say why a player was lucky or unlucky. The previous measure was batting average of balls in play, or BABIP. The problem with BABIP is that it does not account for home runs because it is not a ball in play. Additionally, it does not account for walks, sort of like the actual batting average statistic. So xwOBA does a better job of giving a player credit and sometimes, a low BABIP is justified if hitters are not hitting the ball hard.
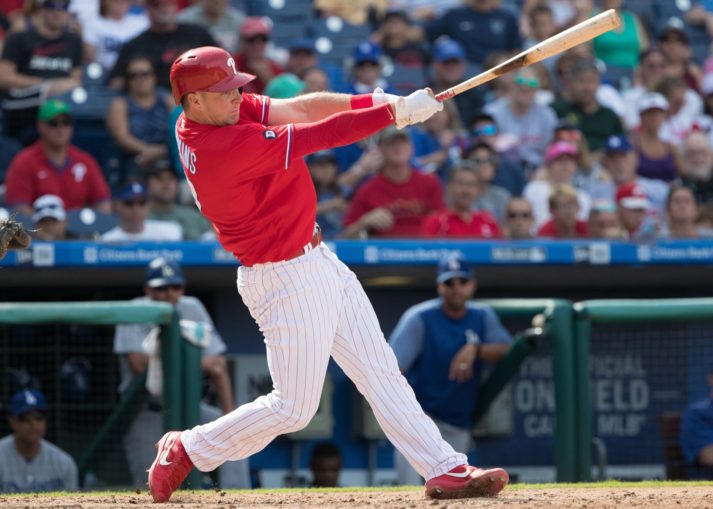
Take Rhys Hoskins for example. Hoskins slashed .259/.396/.618 with a .417 wOBA and 158 wRC+. He hit 18 home runs in just 212 plate appearances which is simply amazing and he also coupled that with a 17.5 percent walk rate. His BABIP was .241, however, which would suggest he was unlucky and should have been better. Here’s the problem: how unlucky were you if you still managed to slash .259/.396/.618? His xwOBA though was .399, a little bit lower than his actual wOBA. So Hoskins really wasn’t unlucky nor did he benefit that much from luck.
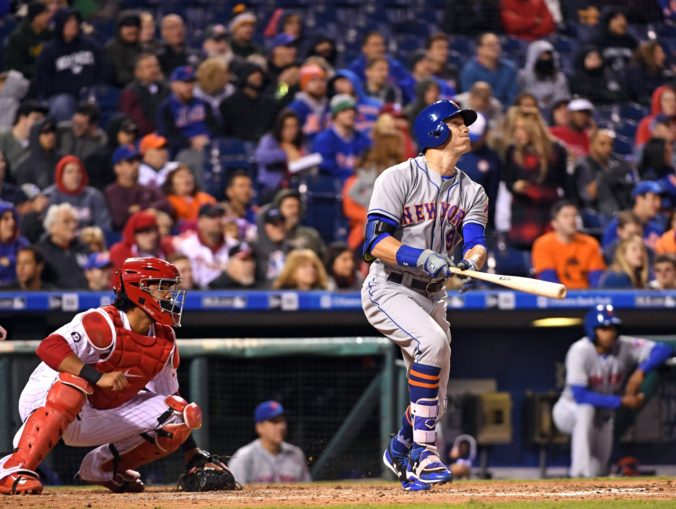
Here’s a Mets related example: Brandon Nimmo. Nimmo really excelled after becoming a regular out there. From the day after Curtis Granderson was traded to the end of the season, Nimmo slashed .259/.375/.453 with a .361 wOBA. He did have a .341 BABIP for that stretch, however, so some people are hesitant in thinking he would be able to maintain this same level of production for the 2018 season. During that stretch though, Nimmo had a .358 xwOBA, almost identical to his actual wOBA.
Why is that? Well Brandon Nimmo had a 14.8 percent walk rate in that time and that number is not too drastic from his season walk rate of 15.3 percent. In fact, Nimmo has shown an elite eye throughout all of his professional career, so there’s a legitimate chance that he is the real deal.
Another guy who did well from that same time frame was Kevin Plawecki. Plawecki slashed .303/.411/.474 with a .391 wOBA. Plawecki made changes to his game because he was hitting more balls in the air than ever before and pulling them with authority. His xwOBA in that time was .371 which would mean he was lucky, but a .371 wOBA for a catcher would still be great.
Well there you have it. This statistic was developed by Baseball Savant and I highly encourage you to play around with Statcast. You can do a lot of your own research as I have on these players and every other player in baseball. These stats are still new, but are becoming very popular around baseball and in front offices.


