Measuring defense accurately is not an easy task. While batting and pitching are relatively binary (you either reached base or you didn’t; you either recorded a strikeout or you didn’t), fielders often deceive us by making routine plays seem phenomenal due to, for example, slow reaction times or by completing an out but taking a less-than-efficient route to get to the ball.
Additionally, with so many plays in the field during any individual baseball game and how fast these plays are completed, much of what separates the above-average fielders from the below-average ones is immeasurable without precise tracking technology that has an eagle eye on every speck of dirt on every player’s uniform.
Enter Statcast, which, for the past five seasons, has provided revolutionary information to the public by way of exit velocities, launch angles, spin rates, and more. While metrics for outfield defense have been active for the past two seasons, infielders have been in the dark — until now.
Infield Outs Above Average, released this past week, aims to provide a more accurate snapshot of defense on the dirt. While popular numbers like Defensive Runs Saved and Ultimate Zone Rating have done an adequate job of answering the same questions, they rely on antiquated methods — the eye test and zone-based systems simply don’t cut it when we can capture the action at tens of thousands of frames per second.
You can get into the nitty-gritty math behind OAA here, but the functions of the system can be broken down into the four components it takes into account (via MLB.com):
- How far the fielder has to go to reach the ball (“the intercept point”)
- How much time he has to get there
- How far he then is from the base the runner is heading to
- On force plays, how fast the batter is, on average
These are all data points that DRS and UZR can estimate, but OAA doesn’t leave anything up for interpretation. The full leaderboards, which can be sliced and diced by team, position, and more, are available on Baseball Savant. It certainly passes the smell test; players like Nolan Arenado and Matt Chapman are near the top and Eric Hosmer and Vladimir Guerrero Jr. are near the bottom.
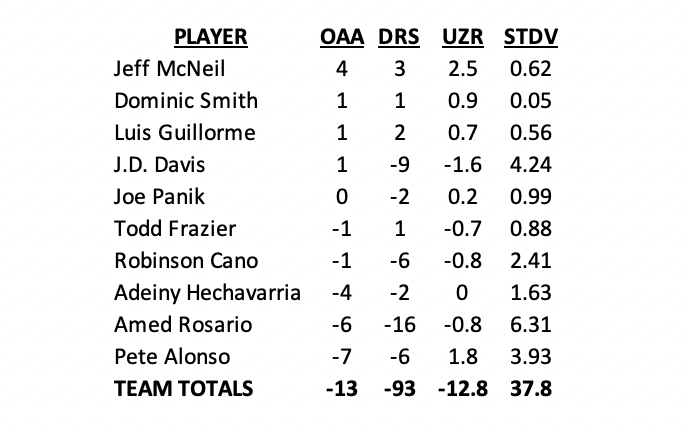
So let’s dive into the data and see what we can learn about the Mets’ infielders. First, here are the raw numbers for Mets with at least ten opportunities alongside their DRS and UZR figures and the standard deviation of all three numbers.
Amed Rosario continues to improve
Though Rosario’s -6 OAA is far from impressive, it is worth breaking down that number by month. You can do just that on the leaderboards at Baseball Savant, but MLB.com’s Mike Petriello has already done the work for us. He gave us this graphic last week.
Interesting graphic via @mike_petriello, showing how bad Amed Rosario was in the field in the first half compared to the last two months of the season. https://t.co/dYyBmoyuOo pic.twitter.com/pqz73BSmSc
— Jacob Resnick (@Jacob_Resnick) January 8, 2020
Rosario’s early-season struggles were no secret, and the numbers overwhelmingly back that up. It’s encouraging, however, that he stayed in the positives in August and September. Should his increased attention to the defensive side of the ball pay off, Rosario could establish himself as a first-division regular in 2020.
J.D. Davis deserving of more credit?
It’s hard to dispute that Davis struggled in the field in 2019 — more drastically in left field, but at third base as well, where he graded out at -9 DRS. But OAA paints a different picture, one in which Davis was serviceable — even slightly above-average — at the hot corner.
Among the 290 infielders who had at least 10 opportunities in 2019, Davis’ estimated success rate was 81 percent, or the seventh-lowest. That isn’t a knock on him; his opportunities were more difficult based on the factors described above (harder-hit balls, faster runners, etc.)
There’s data to back that up as well. Of the 59 third basemen who had at least 50 balls hit to them in 2019, Davis’ opportunities carried an expected-wOBA of .206. That means only one player at the position, Cheslor Cuthbert, saw more well-hit balls come their way. Alex Bregman, for example, is on the other end of the spectrum. Balls hit at him had a collective xWOBA of only .136, third-lowest.
All of this is to say Davis perhaps should be cut some slack for his work at the hot corner (maybe not in left field, where he posted -7 OAA). It will be exciting to see if he can continue to improve and pair a glove with his excellent bat in 2020.
Robinson Cano’s diminishing range
All three of our chosen metrics saw Cano as a below-average defender. What OAA allows us to do, however, is break the numbers down by fielder roles.
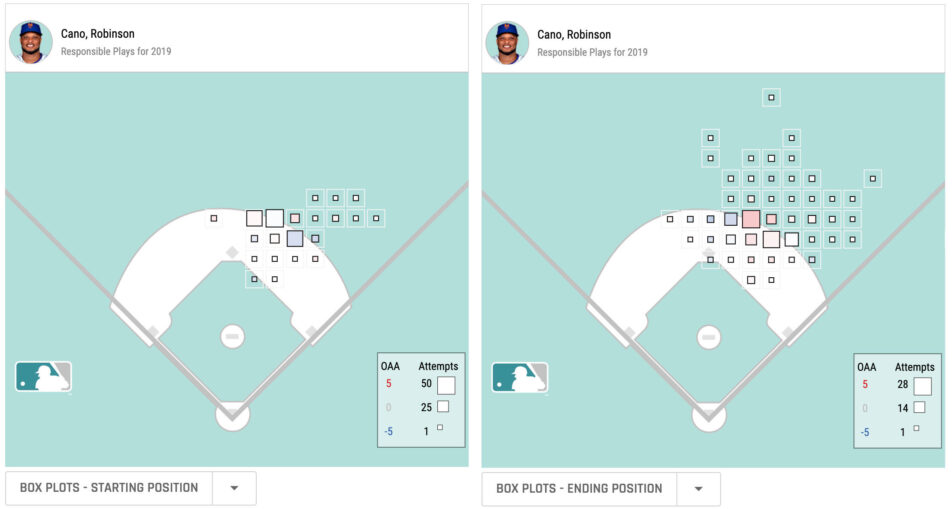
When Cano was strategically positioned (up the middle, behind the first baseman, etc.), which includes four plays where he lined up in the shortstop role, he produced 2.5 OAA. That’s very solid and more in line with the 2.4 OAA he posted as a second baseman for the Seattle Mariners in 2018.
But when Cano was asked to play a traditional second base, and in turn required to cover more range, he struggled, worth -3.4 OAA. That shouldn’t come as a surprise, but it’s striking to see the numbers laid out that way.
To the Mets’ credit, Cano was strategically positioned about 70 percent of the time last year. Still, it’s worth monitoring how well the 37-year-old is able to mitigate his defensive decline.
Pete Alonso still has work to do
Though he ultimately cost the team less than expected in the field, Alonso graded out very poorly according to OAA, which placed him 44th out of 44 first basemen who had at least 50 opportunities in 2019.
Though he was worth one 1 OAA on balls that required him to charge in, Alonso struggled mightily when prompted to move laterally to his right. On those plays, he was worth -6 OAA.
While it won’t matter what he does in the field (especially at first base) as long as he continues to post league-leading home run numbers, improvement can only help the team and its near league-worst figures going forward.


