There are sports writers who did not cast votes for Babe Ruth. Hank Aaron, Willie Mays, and Mets great Tom Seaver were all first ballot Hall of Famers who voters found a reason not to vote for. Yogi Berra was not elected to the hall of Fame until the third ballot.
While only Mariano Rivera has been a unanimous Hall of Fame electee in the 80 year history of the Hall of Fame, one of the more common and reasonable ways for both fans and sports writers to determine who is deserving of a spot is to see if the statistics of the player they are considering for Hall of Fame membership has statistics that are similar, or exceed, the statistics of an already elected Hall of Fame player.
Let’s compare the career statistics of two players. For our comparison, we’ll call them Player A and Player B.
| Player A | Player B | |
| AB | 9,768 | 9,927 |
| H | 2,725 | 2,774 |
| HR | 435 | 438 |
| BA | 0.279 | 0.279 |
| R | 1,582 | 1,373 |
| RBI | 1,587 | 1,591 |
| SB | 312 | 314 |
We’re looking at two outstanding, really similar ballplayers. Note both were power-speed guys, with 400+ home runs and 300+ stolen bases. Both sluggers plated many men, with over 1,500 RBIs each. Very similar statistically, both players had the same lifetime batting average, player B had three more home runs, four more RBIs and two additional stolen bases in 159 more at bats. We can note that player B scored 209 fewer runs which is something to consider as we continue to compare the two ball players.
| Player A | Player B | |
| OBP | 0.350 | 0.323 |
| SLG | 0.486 | 0.482 |
| OPS | 0.837 | 0.806 |
| OPS+ | 119 | 119 |
Well, now we see that Player A had a significant advantage in on base percentage compared to Player B. With the same batting average, Player A was able to get on base more than Player B, which led to Player A scoring 209 more runs than Player B.
We can also see that while Player A had a tick higher slugging percentage (.004), it was really his higher on base percentage that made his OPS higher than Player B. Despite having different OPS’s though, the two players had the same OPS+, which is OPS adjusted for the offensive era and the player’s home ball park. We can surmise that Player A played in a higher offensive era than Player B, which is why his higher offensive output is adjusted downward compared to Player B.
| Player A | Player B | |
| All Star | 9x | 8x |
| Gold Gloves | 3 | 8 |
| ROY | Yes | Yes |
| Silver Slugger | 2 | 4 |
As we review some of the hardware the two players collected, Player A had one more All Star appearance, and both players were Rookie of the Year in their respective debuts. Player B did win two additional Silver Slugger Awards, but the biggest difference in the chart above is that Player B won five additional gold gloves.
| Player A | Player B | |
| MVP Awards | 0 | 1 |
| MVP – Top 5 | 1 | 3 |
| Years w MVP Votes | 7 | 9 |
Both Player A and Player B were consistently excellent, with 16 years of MVP votes among them. Player B does have the advantage though, as he won 1 MVP and had two more top-5 finishes than Player A.
| Player A | Player B | |
| WAR | 69.6 | 64.8 |
| dWAR | 1.6 | 1.6 |
Interesting to note that despite the different number of gold gloves noted earlier, both players had the same career dWAR, and Player A actually had more offensive value (remember the better on base percentage and the greater number of runs scored) than Player B. Player B had a few better peak years, considering the top-5 MVP finishes, but for their career, Player A had the more productive career of these two very statistically similar players.
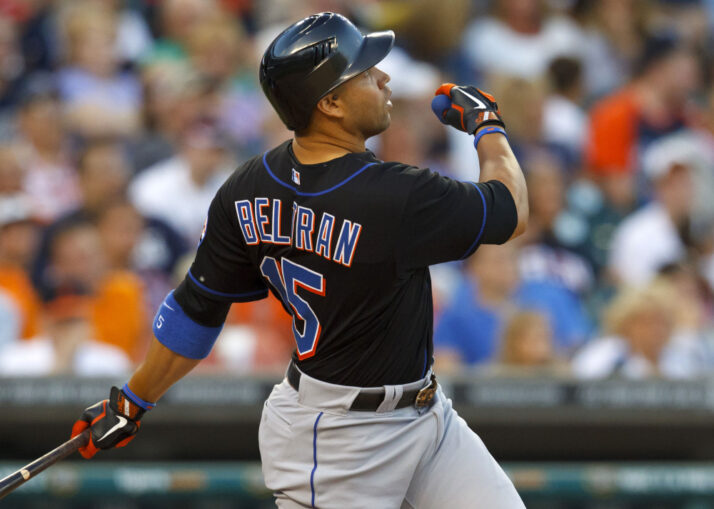
Player A played 20 years in the majors, with the majority of that time in center field, although several seasons were spent in right field and DH. Player B played 21 seasons in the majors with a significant percentage of those games played in center field, although the majority of his games defensively were played in right field.
Player A is Carlos Beltran.
Player B is Andre Dawson.
Andre Dawson was elected to the Hall of Fame in 2010, after never receiving less than 45% of the vote while on the ballot. Carlos Beltran becomes eligible in 2023. Carlos Beltran, as a player, had a Hall of Fame career.


