
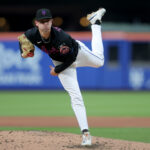
Until my drive home from AT&T Park last night, I never thought the day would come that my feelings after watching a 42-year old, 280+ pound man pitch a quality start would be, “He didn’t really pitch well tonight. We never had a chance.”
Unfortunately, this is the state of the John-Mayberry-hitting-in-the-six-hole Mets.
Without looking at the scoreboard, it almost felt like Bartolo Colon had given up 6 or 7 runs to the San Francisco Giants on Tuesday night; in part because the starting pitching has spoiled us (more so than usual) as of late, but mainly because one gets the sense that the 3 runs given up might not be matched by the Mets until after the all-star break.
However, as a self-proclaimed optimist, this will not be another “man, this offense sucks” piece. Instead, I’d like to offer at least a small bit of hope that the hitting can and will perk up a bit, courtesy of Fangraphs.
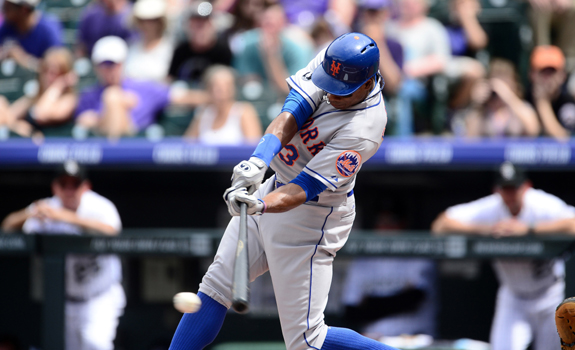
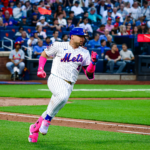
The Mets have two of the MLB’s top ten players in line drive percentage, with Curtis Granderson and Lucas Duda at 6th and 9th respectively (as of July 8). While line drive percentage (LD%) is certainly not the be all, end all of hitting, it is generally accepted as an adequate way to determine how a player is performing at the plate, with the idea being that line drives give a hitter a greater opportunity to reach base than a fly ball or grounder would.
For the purposes of this argument, I’ll focus mainly on Granderson and compare him to a player that on the surface is having a much better year, but compares very similarly when it comes to several advanced statistics—Mike Trout.
Curtis Granderson’s LD% of 27.7% puts him 2.4% ahead of Trout, with his ground ball percentage sitting about three points lower than Trout’s (31.3 vs. 34.8) and his fly ball rate only 1.3% higher (41.1 vs. 39.8). While Mike Trout’s home run per fly ball percentage of 23.9% blows Grandy’s 14.1% out of the water, the aforementioned numbers would suggest that, outside of power totals, the two should be having somewhat similar statistical seasons, but this is not the case.
The Angels star’s 2015 season has him on pace to slightly outperform his MVP-winning stats of 2014, while Granderson, whose 23.0% strikeout rate is actually 0.4% lower than Trout’s, blends in with the slew of .250 hitters the Mets continue to start. Mike Trout’s batting average on balls in play (or BABIP, which excludes things such as walks, strikeouts, and home runs) sits at .345, with Granderson’s at .just 297.
They hit the same type of ball (line drive, ground ball, fly ball) in close to the same percentage of at bats. They strike out in close to the same percentage of at bats. So why are Trout’s average and BABIP each about 50 points higher?
The point to the above avalanche of numbers is this: yes, many Met hitters have performed very poorly this season, and many others simply shouldn’t be playing in the majors, at least right now.
But for players such as Granderson, luck and chance have played a definite role in a first half that most been mostly diasappointing. (He is the only hitter in the top 12 of LD% with a BABIP under .300.) Were he to have hit second or third this season in a lineup that gave him the opportunity to produce more runs, he would have a stat line that loosely resembles one of the best hitters in the game, someone that Met fans (or any other MLB team) would want playing for their team in a heartbeat.
So while no Met other than Granderson has hit one over the fence since June 20, the numbers say that the offense cannot continue to be this putrid. Granderson should join Daniel Murphy as a stable form of production, and others like Duda and Wilmer Flores should start seeing results.
No, the 2015 Mets will never be the Murderer’s Row of 1927. But the complete absence of offense that has persisted throughout most of the season can’t last another 77 games. Right?


