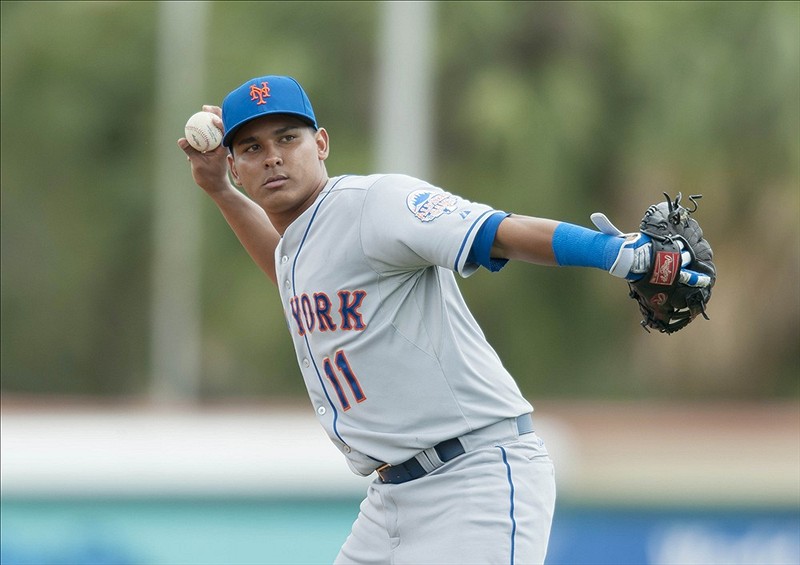
There was a brief time in 2012, as Mets fans tried to recover from the loss of Jose Reyes, that Ruben Tejada seemed to have promise. With his recent struggles, and never-ending love/hate relationship projected upon him by Mets management, it is hard to remember those days. It makes me wonder: Where did Ruben Tejada go wrong?
| PA | BB% | K% | wOBA | fWAR | |
| 2012 | 501 | 5.4% | 14.6% | 0.304 | 1.8 |
| 2013 | 227 | 6.6% | 10.6% | 0.236 | -0.3 |
It is clear that his numbers in 2012, with more plate appearances, were better than last season. Despite handling the bat better in 2013 – he struck out less and walked more – Tejada became an anemic hitter. His promising .289 BA in 2012 caught trap to a high batting average on balls in play (BABIP) of .339, leading to a .202 BA in 2012 with his BABIP dipping to .228. Any strides he made getting on base more often via the walk were offset by his inability to get on base in any other manner.
Looking closer at Tejada’s 2012 numbers, however, we can see that things started to go wrong long before the 2013 season began. As the table below highlights, Tejada got off to a great start in 2012, hitting 13% better than league average in terms of OPS for the month. He followed a high BABIP with limited at-bats through his first summer as Mets shortstop, and then, with a heavy workload towards the end of the year, his numbers quickly regressed.
| 2012 | PA | BA | BABIP | League Comparison (OPS) |
| March/April | 98 | 0.299 | 0.377 | 13% |
| May | 19 | 0.333 | 0.462 | 23% |
| June | 34 | 0.323 | 0.357 | 5% |
| July | 114 | 0.315 | 0.378 | -7% |
| August | 118 | 0.261 | 0.292 | -15% |
| September | 118 | 0.266 | 0.302 | -29% |
Tejada found that his BABIP plummetted in 2012 when he hit more ground balls and less line drives as the season progressed. The graph below courtesy of fangraphs shows the inverse trend of his GB% and FB% during the course of 2012. Following the same trend in 2011, he found late season success, hitting .348 in the month of August with a .400 BABIP. You can see the slight blip towards the end of the 2011 portion of the graph where his LD% climbed and both his GB% and FB% dropped.
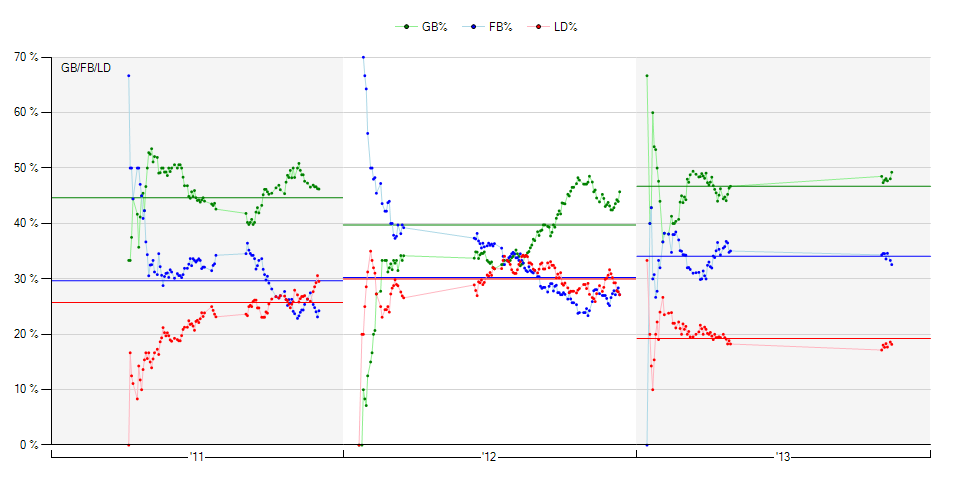
(Click to open in new window)
Overall, it is quite clear. Tejada does not produce any power, he relies heavily on balls in play falling for hits. Late in 2011 and early in 2012, he was able to connect on line drives more often. By 2013, he was hitting mostly ground balls and fly balls, with very limited line drives. His BABIP suffered, and so did his overall batting average.
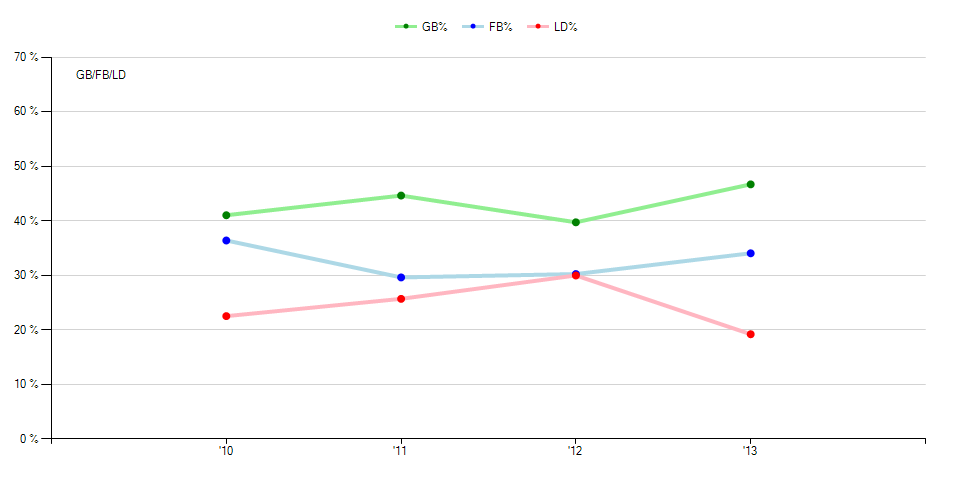
(Click to open in new window)
Why did Tejada start hitting less line drives? Because pitchers became wise to the fact that he was able to connect more effectively on offspeed pitches. In the first three months of 2012, Tejada saw his offspeed offerings at 11.8%, 19.1%, and 10.7% of total pitches seen. By the end of the season, pitchers were only throwing Tejada offspeed pitches 3.9% of the time. The graph below shows that of all pitch types, Tejada found line drives most frequently at the end of at-bats where he made contact with offspeed pitches. With opponents throwing less offspeed pitches, he hit less line drives.

Ruben Tejada is an interesting case. He is not an elite shortstop, and never will be. It is clear that management needs to loosen the purse strings and acquire a legitimate replacement. However, it is interesting to look back and understand a little clearer what happened to Tejada’s once promising start.
All statistics courtesy of Baseball-Reference and Brooks Baseball.


