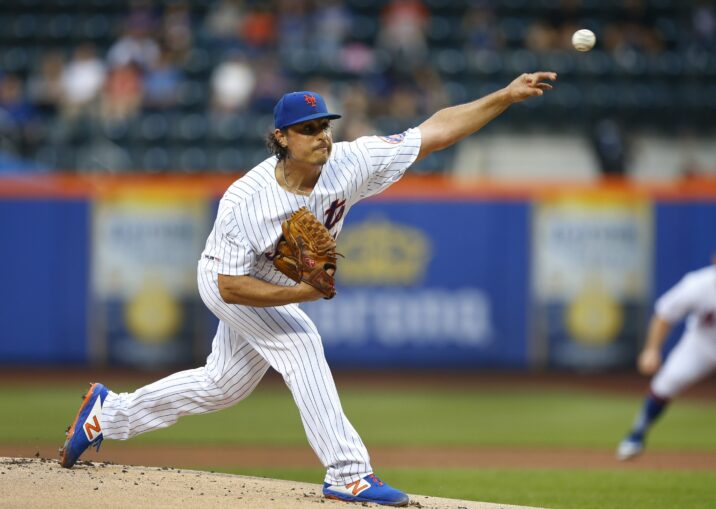
Jason Vargas just put together his third consecutive quality start, with his most recent outing against the New York Yankees in the Bronx. And even though his 2019 season didn’t get off to the best of starts, he’s rebounded in a big enough way where those struggles have been completely erased from his season-long statistics.
What a time to be alive, you guys.
Through 51.1 innings, the veteran southpaw has compiled a 3-3 record with a respectable 3.68 ERA and 1.36 WHIP. It’s been accompanied by an 18.1% strikeout rate and 9.5% walk rate, which has resulted in a 5.14 SIERA. With the way he goes about his business, though, Vargas will likely always outperform his peripherals when having success on the mound. More importantly, his 0.8 fWAR is already much more than the 0.2 he accumulated last season in 92 innings for the New York Mets.
The most obvious change has happened since the last six weeks. After one month of appearances (20.1 innings), he owned a 5.75 ERA. But since the start of May (31 innings), his ERA is all the way down to 2.32. As one can imagine, there have been a number of improvements in Vargas’ profile, but the following three really stick out to me.
Plate-Discipline Stats
When comparing Vargas’ strikeout and walk rates from 2018 to what he’s currently put together, there is a small downturn in production. That’s mostly because of the rough April he endured, though. Here’s how his strikeout rate (K%), walk rate (BB%), first-pitch strike rate (F-strike%), and swinging-strike rate (SwStr%) compare through the end of April and since May 1st.
| 2019 | K% | BB% | F-strike% | SwStr% |
|---|---|---|---|---|
| Through April 30th | 15.5% | 12.4% | 54.6% | 6.8% |
| Since May 1st | 20.2% | 7.3% | 60.5% | 8.4% |
It’s always a welcome sight to see a starting pitcher’s strikeout-to-walk ratio go from 3.1% to 12.9%, right? With this improved control has also come a better ability to strand those runners who do get on base.
That number had settled in at 75.7% through the end of April but has ticked up a bit to 80.4%. While both of these percentages are above Vargas’ career strand rate (73.2%), it’s nice to see it’s a step in the right direction when compared to last season’s 68.3% mark.
The southpaw has also seen opposing hitters swing at his pitches more often, which has led to less contact. That’s all great, but for someone with his overall profile (a soft-tossing lefty that doesn’t strike out many guys), controlling contact is incredibly important.
Which brings us to our next subject…
Shift in Batted-Ball Profile
Mets starters dominated the quality-of-contact leaderboards last season. Vargas wasn’t included in that domination, and with regard to his current season-long statistics, he’s still not.
When looking at starting hurlers with at least 50 innings pitched, Vargas’ 40.5% hard-hit rate allowed is among the worst in baseball, as is his 16.3% soft-hit rate. Of course, most of this is because of what happened in April. Here’s a breakdown of how his line-drive rate (LD%), ground-ball rate (GB%), fly-ball rate (FB%), soft-hit rate (Soft%), and hard-hit rate (Hard%) changed from one time period to the next.
| 2019 | LD% | GB% | FB% | Soft% | Hard% |
|---|---|---|---|---|---|
| Through April 30th | 15.4% | 38.5% | 46.2% | 18.8% | 53.6% |
| Since May 1st | 23.3% | 44.4% | 32.2% | 13.3% | 30.0% |
This is by no means a perfect progression, but some solid changes have taken place. Although it’s not fun to see the soft-hit rate get worse, it sure is fun to see that hard-hit rate look more normal. And despite a rise in line-drive rate, it’s come solely at the expense of his fly-ball rate. Which, judging from his homers allowed per nine innings, is a very good thing.
After allowing 1.77 dingers per nine innings in April, that number has dropped all the way down to 0.29 since the start of May. Sustaining his current pace isn’t likely, but at least his 0.88 HR/9 mark on the season is more in line with his career rate (1.17) than what he did in April or in 2018 (1.76).
Increase in Curveball Usage
It shifted in the early years of his career, but Vargas now leans on his four-seamer, sinker, changeup, and curveball when toeing the slab. Upon taking a gander at his season-long stats, one would assume his changeup is the story since his 34.5% usage is on pace to be a career-high mark.
Not exactly, though. While opposing hitters have produced just a 73 wRC+ against Vargas’ changeup, it looks like the increased usage of his curveball has helped along the way. Here’s how his pitch mix has shifted between the two time periods we’ve been discussing here.
| 2019 | FB% | CB% | CH% |
|---|---|---|---|
| Through April 30th | 57.3% | 7.6% | 35.2% |
| Since May 1st | 53.1% | 13.0% | 33.9% |
The left-hander has relied less heavily on his fastball in favor of his curveball, and based on the season-long statistics for his breaking ball, that’s been a good decision. This offering has produced the best walk rate (3.8%), strikeout rate (23.1%), OPS (.522), and wRC+ (43) among all the pitches he’s thrown in 2019. His curveball accomplished the exact same feat in 2018, too (3.2% walk rate, 37.1% strikeout rate, .550 OPS, 63 wRC+).
How much longer will this last? That’s the big question, especially for a pitcher who outperforms his peripherals like Vargas — it’s a fine line he’ll continually walk. Either way, there have been some clear improvements since a tough first month, and he’s already been more productive than many expected he’d be this season.


