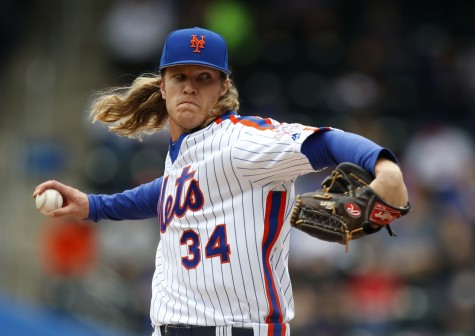
Noah Syndergaard helped complete the New York Mets three game sweep of the Milwaukee Brewers using a pitching strategy Matt Harvey successfully utilized last season.
Noah Syndergaard (W, 5-2) 7.0 IP, 1 R, 6 H, 11 SO, 0 BB
Syndergaard’s overall transition in pitch selection has been obvious, using his newly found sharp, high velocity slider 18% more while throwing his curveball 12% less compared to last season. Overlooked is Syndergaard’s dedication in establishing his fastball early in games, setting up his off-speed pitches later in games.
Here is Syndergaard’s pitch breakdown per inning from last night’s performance (FB = Fastball, CH = Changeup, SL = Slider, CB = Curveball):
1st Inning: 17 FB (73.9%), 0 CH (0.0%), 2 SL (8.7%), 4 CB (17.4%) = 23
2nd Inning: 12 FB (70.6%), 0 CH (0.0%), 2 SL (11.8%), 3 CB (17.6%) = 17
3rd Inning: 11 FB (64.7%), 1 CH (5.9%), 1 SL (5.9%), 4 CB (23.5%) = 17
4th Inning: 8 FB (50.0%), 4 CH (25.0%), 2 SL (12.5%), 2 CB (12.5%) = 16
5th Inning: 6 FB (66.6%), 2 CH (22.2%), 0 SL (0.0%), 1 CB (11.1%) = 9
6th Inning: 5 FB (35.7%), 5 CH (35.7%), 1 SL (7.1%), 3 CB (21.4%) = 14
7th Inning: 7 FB (53.8%), 3 CH (23.1%), 2 SL (15.4%), 1 CB (7.7%) = 13
During the first three innings or first two at-bats for the core of the Brewers lineup, Syndergaard challenged Brewers hitters with his fastball knowing it will take them a few times through the batting order to adjust to his 99 mph fastball.
This creates Brewers hitters to come up for their third and four at-bats against Syndergaard expecting and ready to hit his fastball. However at this point in the game, Syndergaard changes and mixes his pitch selection.
Although Syndergaard’s slider and curveball usage remain relatively steady, his fastball usage decreases from 70.2% during the first three innings to 50.0% during the last four innings. Conversely, Syndergaard’s changeup usage increases from 1.8% during the first three innings to 26.9% during the last four innings.
This caught Brewers hitters off guard, keeping them off-balance in the batter’s box translating to less aggressive swings and weaker contact. Additionally, by saving his changeup until the third and fourth time through the Brewers lineup, Syndergaard’s changeup is not only a pitch Brewers hitters aren’t expecting but have not seen. This allows Syndergaard’s changeup to look even more deceiving and devastating, helping create the extraordinary 40.0% miss/whiff rate with his changeup last night.
This culminated in Syndergaard allowing his second lowest hard contact % of the season at 18.8% and his second highest soft contact % of the season at 31.3%.
David Wright’s Arm
On a routine ground ball during the top of the sixth, David Wright threw a bullet across the infield to throw out Ryan Braun at first base. So far this season, Wright has transitioned into almost exclusively throwing sidearm and even submarine depending on the play, both of which are generally more erratic leading to greater fielding errors. It’s great to see Wright making strong overhand.
Although Wright’s spinal stenosis condition cannot go away, this throw may signal a few consecutive days off every month is a viable temporary solution to help keep Wright on the field through the end of this season.
Stat of the Night
SNY showed statistics I’ve been preaching about the past few weeks: The Mets offense produces the highest percentage of their runs through home runs in MLB (55% of all runs scored produced through home runs). The Mets have by far the lowest batting average with runners in scoring position in MLB (.210). This trend continued this series as the Mets offense produced over 54.5% of their runs via the long ball (6 of 11 runs scored).
Follow Chris Zaccherio on Twitter @ziography for more Mets insight going beyond statistics.


