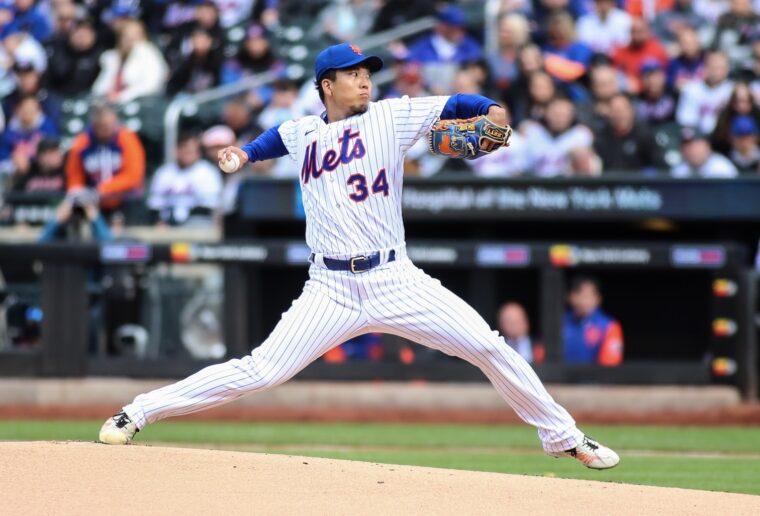
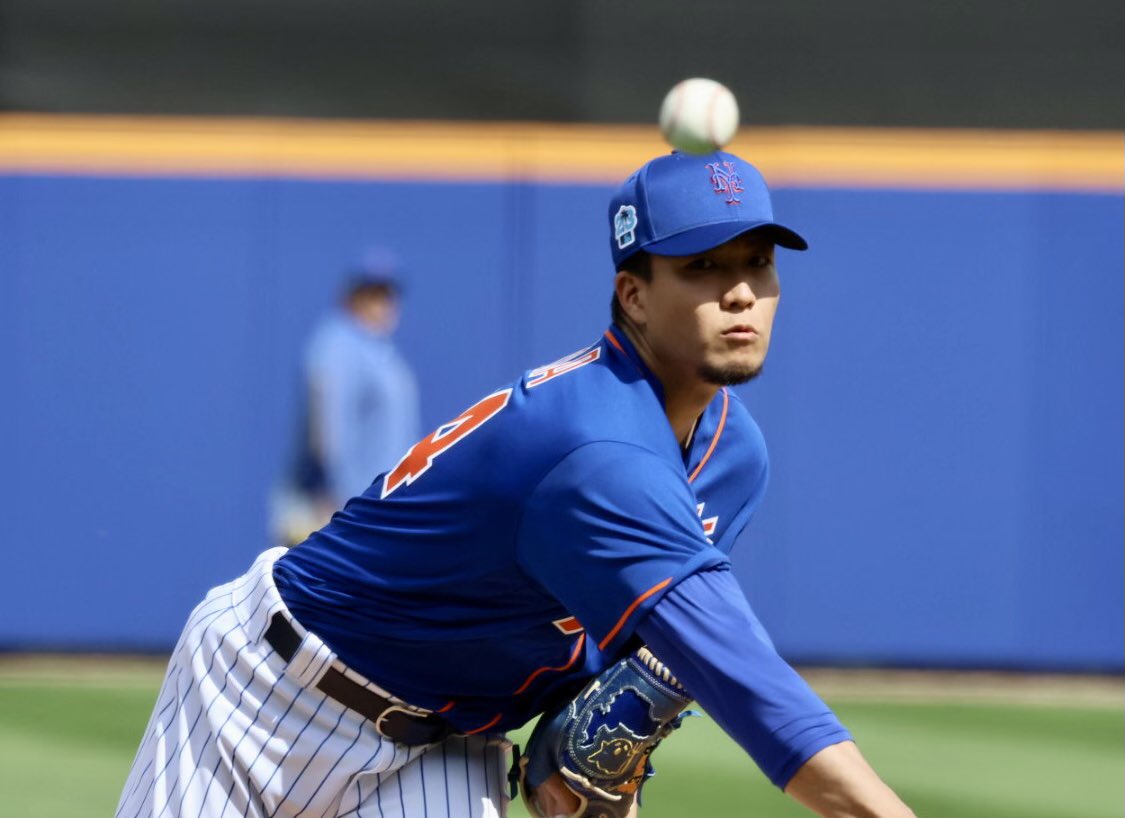
Kodai Senga. Vincent Carchietta-USA TODAY Sports
When Kodai Senga signed his contract with the New York Mets this offseason, a certain adjustment period was expected. The Mets have been treating Senga with kid gloves, giving him extra rest regularly due to his norms from Japan. They knew that control might be an issue, as his walk rate overseas was quite high. There was a question about how he would adjust to the new baseball.
Indeed, Senga has had his ups and downs in a Mets’ uniform thus far. His 29.8 percent strikeout rate is excellent (84th percentile among starting pitchers). However, his 13.2 percent walk rate is quite the opposite (11th percentile).
He’s had four starts in which he went at least six innings and gave up no more than one run, but he’s also had three in which he surrendered at least four runs in five innings or fewer.
The most astonishing split that Senga holds right now is starker than the Mets could have seen coming. Although Citi Field is known as a pitcher’s park, the right-handed pitcher’s home-road splits are eye-opening. He has had five starts at Citi Field and five away. Here are the numbers:
- Home: 30.0 IP (6.0 per start), 14 H, 4 ER, 1 HR, 14 BB, 38 K, 1.20 ERA, 0.93 WHIP, .136/.293/.194/.434
- Away: 25.0 IP (5.0 per start), 29 H, 17 ER, 5 HR, 17 BB, 32 K, 6.12 ERA, 1.84 WHIP, .287/.390/.485/.875
In other words, Senga pitches like Shohei Ohtani at home, and opposing batters hit him like they’re nearly Ohtani when he pitches on the road. Is it just Citi? Or is there something more going on? Why does Senga have such severe splits? Will he ever be able to improve them?
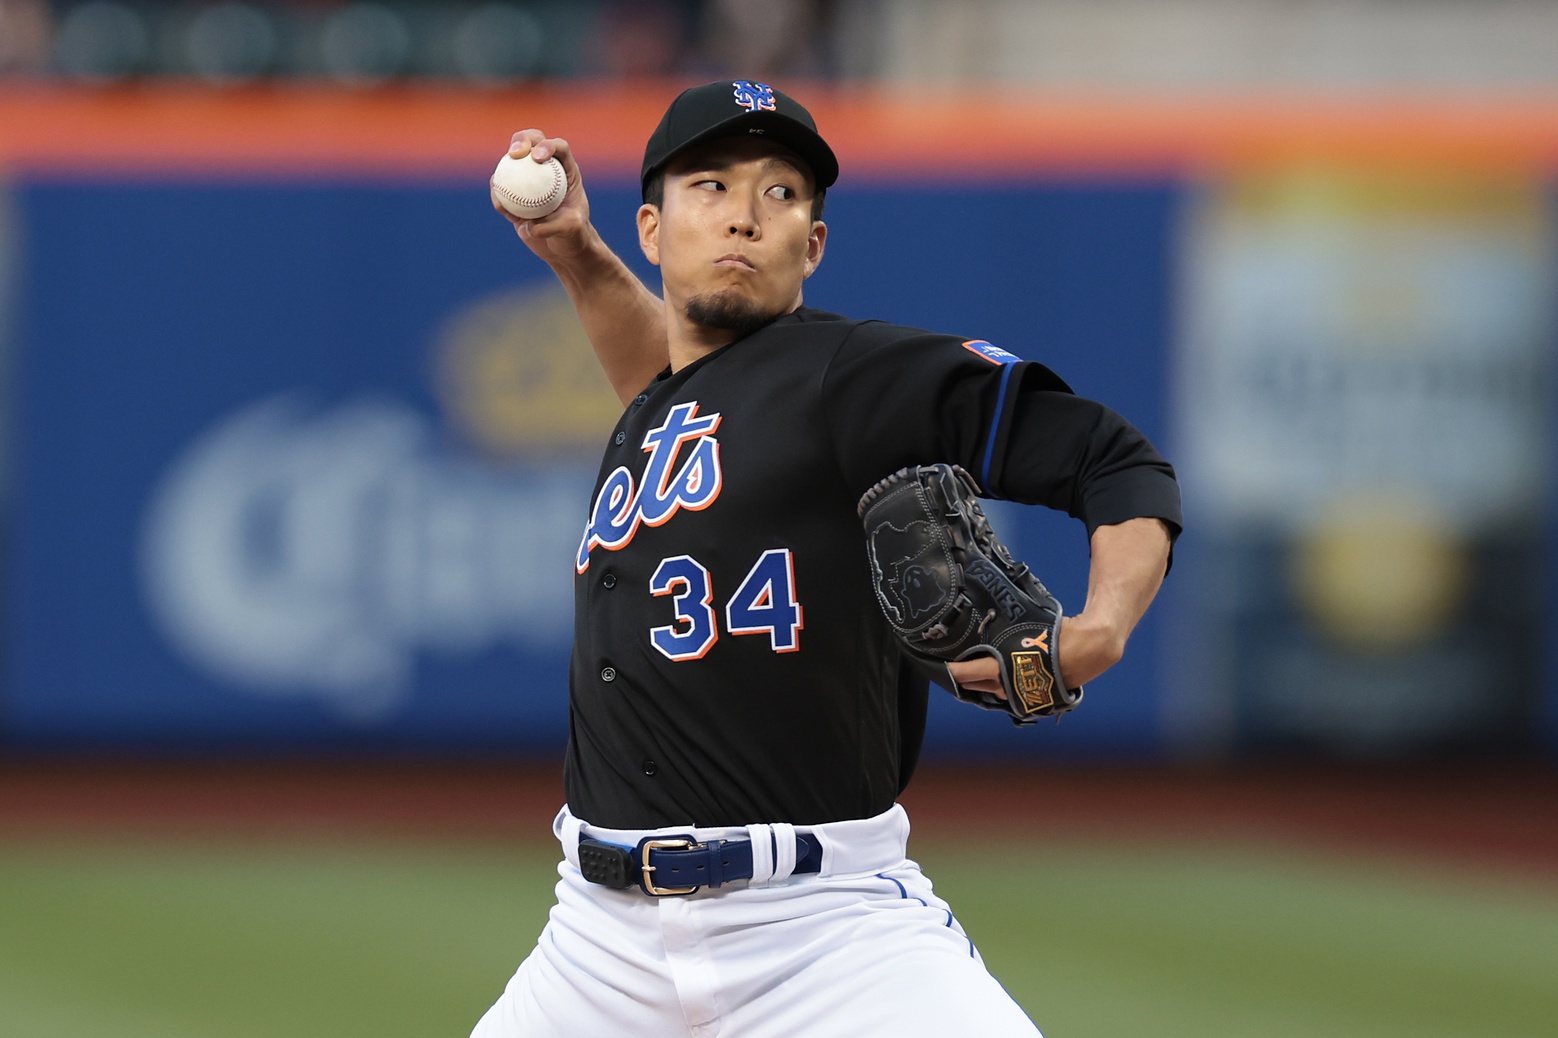
Kodai Senga. Vincent Carchietta-USA TODAY Sports
Maybe It Is Just Citi
Senga is not the only Mets’ pitcher with pretty divergent home-road splits this season. Max Scherzer, Tylor Megill, and even David Peterson have better numbers at home than on the road. However, Scherzer’s and Peterson’s came with just two games pitched at home, so there’s not much to be concluded from there. Megill, though, has six starts each at home and away. Here are his numbers:
- Home: 32.2 IP (5.4 per start), 25 H, 11 ER, 2 HR, 17 BB, 23 K, 3.03 ERA, 1.29 WHIP, .221/.312/.319/.631
- Away: 26.2 IP (4.4 per start), 39 H, 23 ER, 6 HR, 15 BB, 25 K, 6.08 ERA, 2.03 WHIP, .328/.407/.521/.928
Megill is not as good as Ohtani at home, but those are some Mike Trout-like MVP numbers for opponents on the road. At home, Megill has been a fine pitcher. On the road, he’s heading back to Triple-A.
Overall, here were the splits for the Mets’ entire pitching staff heading into the series with Toronto.
- Home: 214.0 IP, 179 H, 99 ER, 30 HR, 89 BB, 199 K, 4.16 ERA, 1.25 WHIP, .227/.313/.376/.688
- Away: 280.0 IP, 280 H, 151 ER, 46 HR, 112 BB, 277 K, 4.85 ERA, 1.40 WHIP, .259/.337/.447/.784
Those are not as stark as Senga’s or Megill’s, but they’re still significant. In 2022, the team difference in ERA was over a full run (3.06 vs. 4.14); Jacob deGrom‘s career difference is 0.80, which means that he was also significantly affected.
In fact, per Baseball Savant, Citi Field has been considered the third-best pitcher’s park in baseball over the last three seasons with a 95 overall park factor (100 being average, below it favoring the pitcher and above favoring the hitter). Only the Padres’ and Mariners’ home parks give more of an advantage to the pitchers.
In what specific areas does Citi help pitchers the most? Well, it is tied for the third-lowest run factor (90), fourth-lowest OBP (97), third-lowest hit (94), fifth-lowest triple (68), and eighth-lowest homer (86), but has the lowest double factor (84). On the other hand, Citi Field is actually tied for the eighth-highest park factor when it comes to walks (104) and the fourth-highest for strikeouts (106).
It seems that one of the biggest factors is preventing extra-base hits, which is likely why the run-scoring factor is also one of the lowest. This could definitely explain a large portion of the disparity in Senga’s splits. Interestingly, Senga’s six home runs allowed would have actually been expected to be seven at Citi Field, per Baseball Savant. It is possible, though, that the one difference was Brandon Nimmo‘s catch at the wall to rob the Phillies’ Nick Castellanos.
It is also notable, though, that Senga is giving up somewhat less hard contact at home. Per FanGraphs, his hard-hit rate is 29.2 percent at home vs. 37.7 percent on the road, and his average launch angle is 11.5 degrees vs. 15.4 degrees.
This may explain why his homer-to-fly ball ratio is just four percent at home but is a whopping 22.7 percent on the road, but it would also bring back the question of why Senga is being walloped on the road.
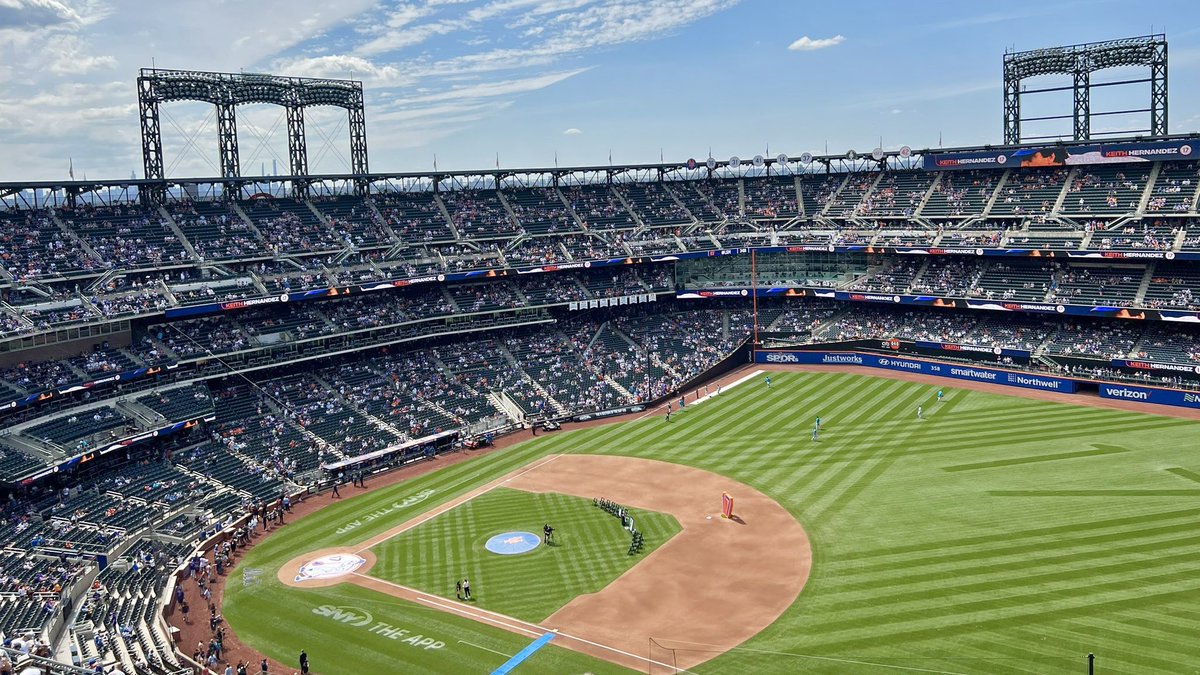
Citi Field.
Road Parks
Senga’s worst start of the season came in one of baseball’s great hitters parks, Great American Ball Park in Cincinnati. Its 109 park factor ranks as the third-friendliest to hitters in all of baseball, and its 131 home run factor ranks first. The fact that Senga gave up five runs in five innings there isn’t all that surprising, although it came on just one home run.
Still, Senga’s next two poorest starts came in parks that lean toward pitchers, namely the Oakland Coliseum and San Francisco’s Oracle Park. The Coliseum is tied for the third-most pitcher-friendly ballpark in baseball with a 96 park factor, and Oracle Park is tied for 12th at 99. That includes 84 and 83 home run factors, the third- and fifth-most pitcher-friendly, respectively. Still, Senga allowed two home runs in each of those parks.
In other words, the only ballpark that could be considered the true explanation of Senga’s difficulties is in Cincinnati. Wrigley Field is more of a hitters’ park (101 park factor, tied for ninth-most hitter-friendly), and it is 14th in home run factor at 104. Still, even on the road, three of the five ballparks Senga has pitched in have been pitchers’ parks. The other was the Marlins’ loanDepot Park, which is the sixth-most pitcher-friendly at 97 and tied for the fifth-most pitcher-friendly for home runs at 84.
Eight of Senga’s 10 overall starts have come in pitchers’ parks. So why is he struggling so much more on the road than at home?
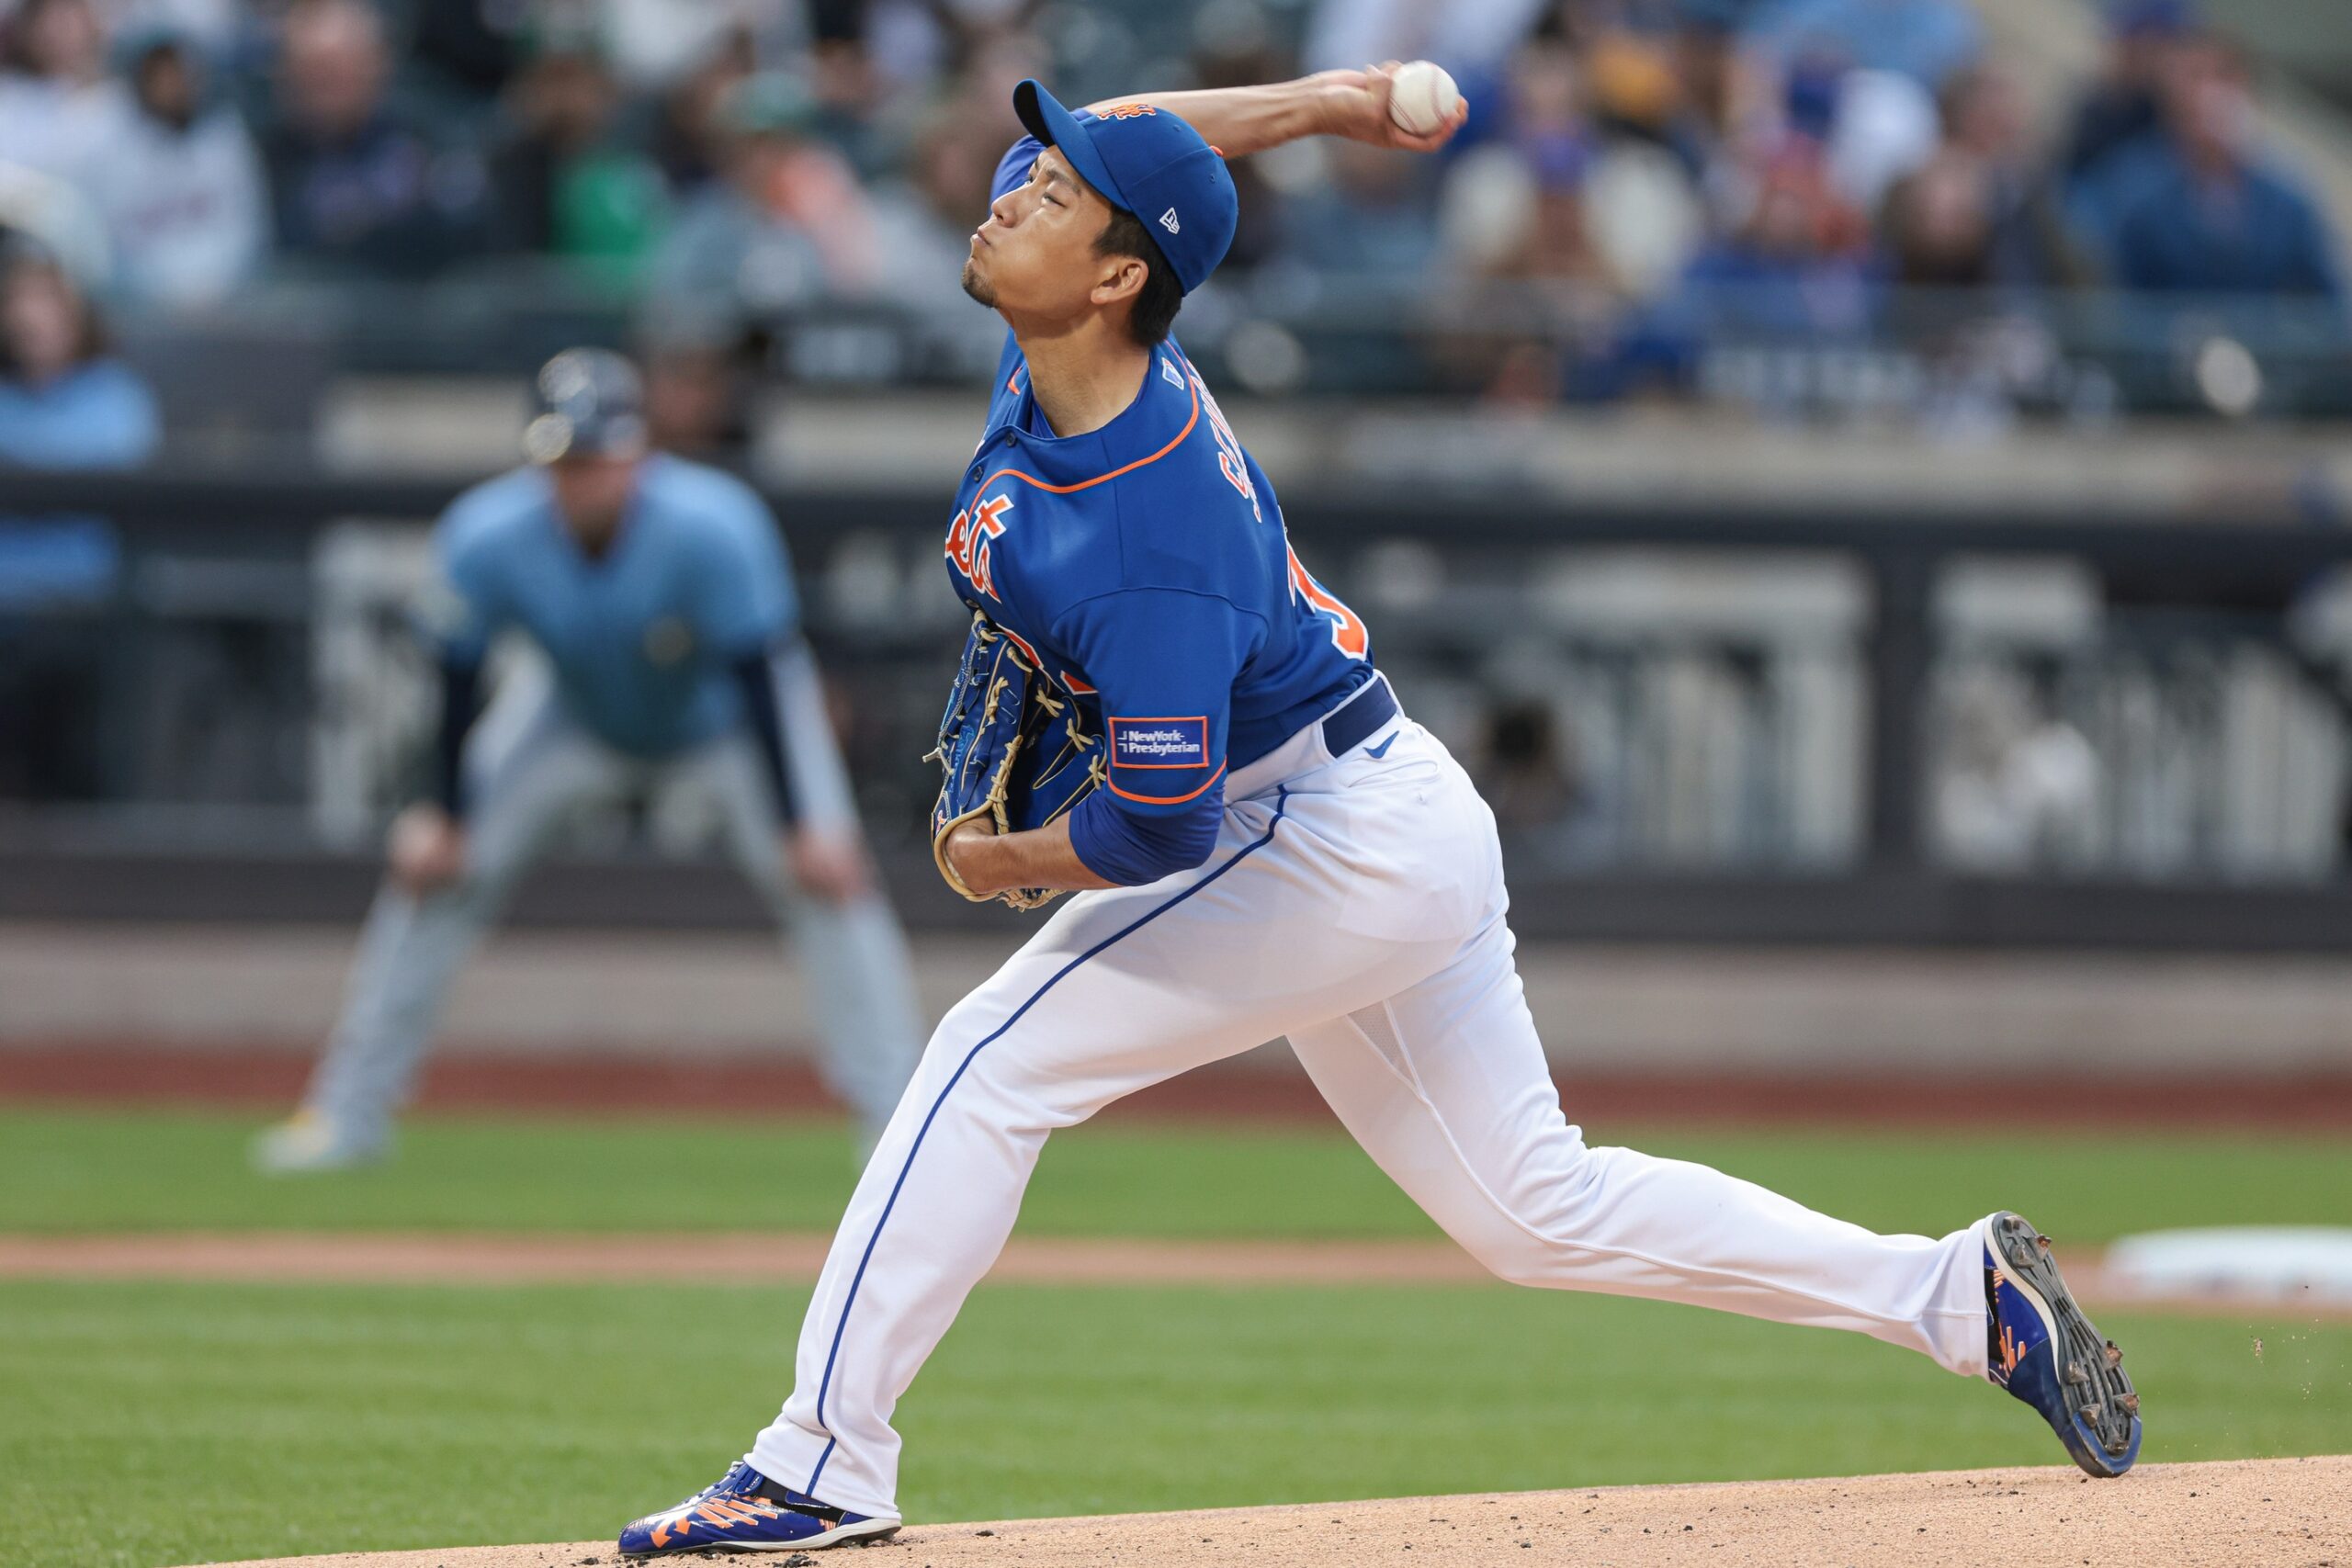
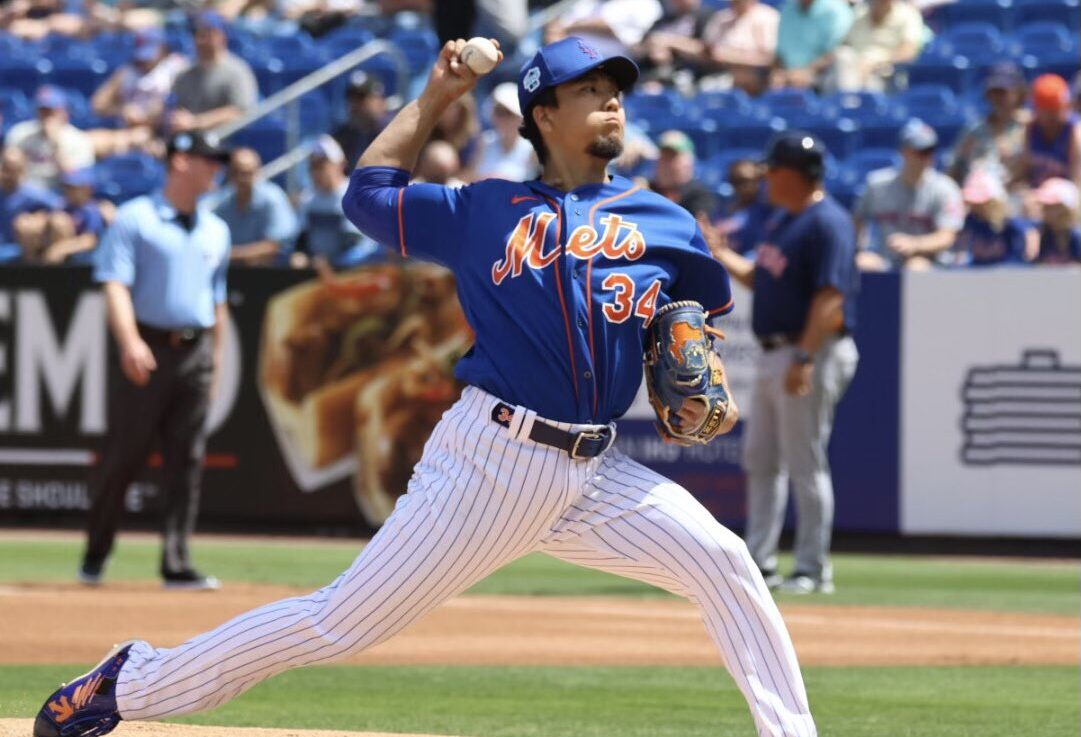
Kodai Senga. Photo by Ed Delaney, MMO
Chase Rate
Another factor to keep in mind is which opponents Senga faced on the home and road. Specifically, how often do those teams’ hitters tend to chase pitches, and of those, how often do they make contact?
This is particularly important because Senga’s signature ghost fork breaks out of the strike zone. He has also dealt with inconsistent command of his other pitches. Senga’s 26.8-percent chase rate is also in the 34th percentile among pitchers, meaning he is not great at inducing batters to swing at those pitches out of the zone. This may be in part because they lay off his pitches in unfavorable counts, expecting the ghost fork to give them a ball.
When the ghost fork is swung at, it has been nearly unhittable thus far. Opponents are slashing .105/.239/.123 ( .362 OPS) against it with a 59.7 percent whiff rate. However, it is thrown in the zone just 24.1 percent of the time, per FanGraphs.
Although the total swing rate against it is 44 percent, it is just 34.1 percent when the pitch is out of the zone. Therefore, as his signature putaway pitch (28.1 percent of the time), he relies on batters swinging at a pitch that they have been fairly disciplined against, knowing they cannot hit it.
Here are his splits between Senga’s home and road opponents in terms of their chase rates, per Baseball Savant.
Home:
- Marlins – 30.1% (25th)
- Nationals – 29.3% (19th)
- Rockies – 30.9% (26th)
- Rays – 29.7% (24th)
- Phillies – 31.7% (28th)
Away:
- Marlins – 30.1% (25th)
- Athletics – 28.4% (16th)
- Giants – 26.7% (T-9th)
- Reds – 25.4% (3rd)
- Cubs – 26.7% (T-9th)
There is something immediately evident in this data: the teams that Senga performed well against, on average, all chase pitches out of the zone more than average, while the teams that did well against him generally have more plate discipline. This has nothing to do with whether he was at Citi or on the road. In fact, his first start of the year was in Miami, where he went 5 1/3 innings and gave up one earned run. His worst starts were against Oakland, San Francisco, and Cincinnati, who swing much less at pitches out of the zone.
This is a trend that Senga will likely see continue unless he can find a different out pitch to complement his forkball. The best candidates for that are the four-seam fastball (20 percent whiff rate, 18.8 percent putaway rate) or cutter (21.2 percent whiff rate, 20 percent putaway rate). Although neither one has nearly the whiff rate that the ghost fork does, both have been fairly effective out pitches for him. The cutter may be a better choice because it has a lower xBA and xSLG (.246/.360 vs. .275/.406).
Senga must threaten opposing lineups with a two-strike pitch within the zone in order for them to be fooled by the pitch out of the zone. There have been times that his four-seamer has done that very effectively, freezing batters who were expecting a forkball in a high-leverage spot.
The thing is that the team’s contact rates on balls out of the zone don’t matter as much because the forkball is so dominant. Even hitters that often make contact out of the zone could struggle against the fork. The main issue is getting those swings in the first place.
For what it’s worth, Senga’s next opponent, the Toronto Blue Jays, rank 11th with a 27.0 percent chase rate. It’s something that bears watching in the matchup.
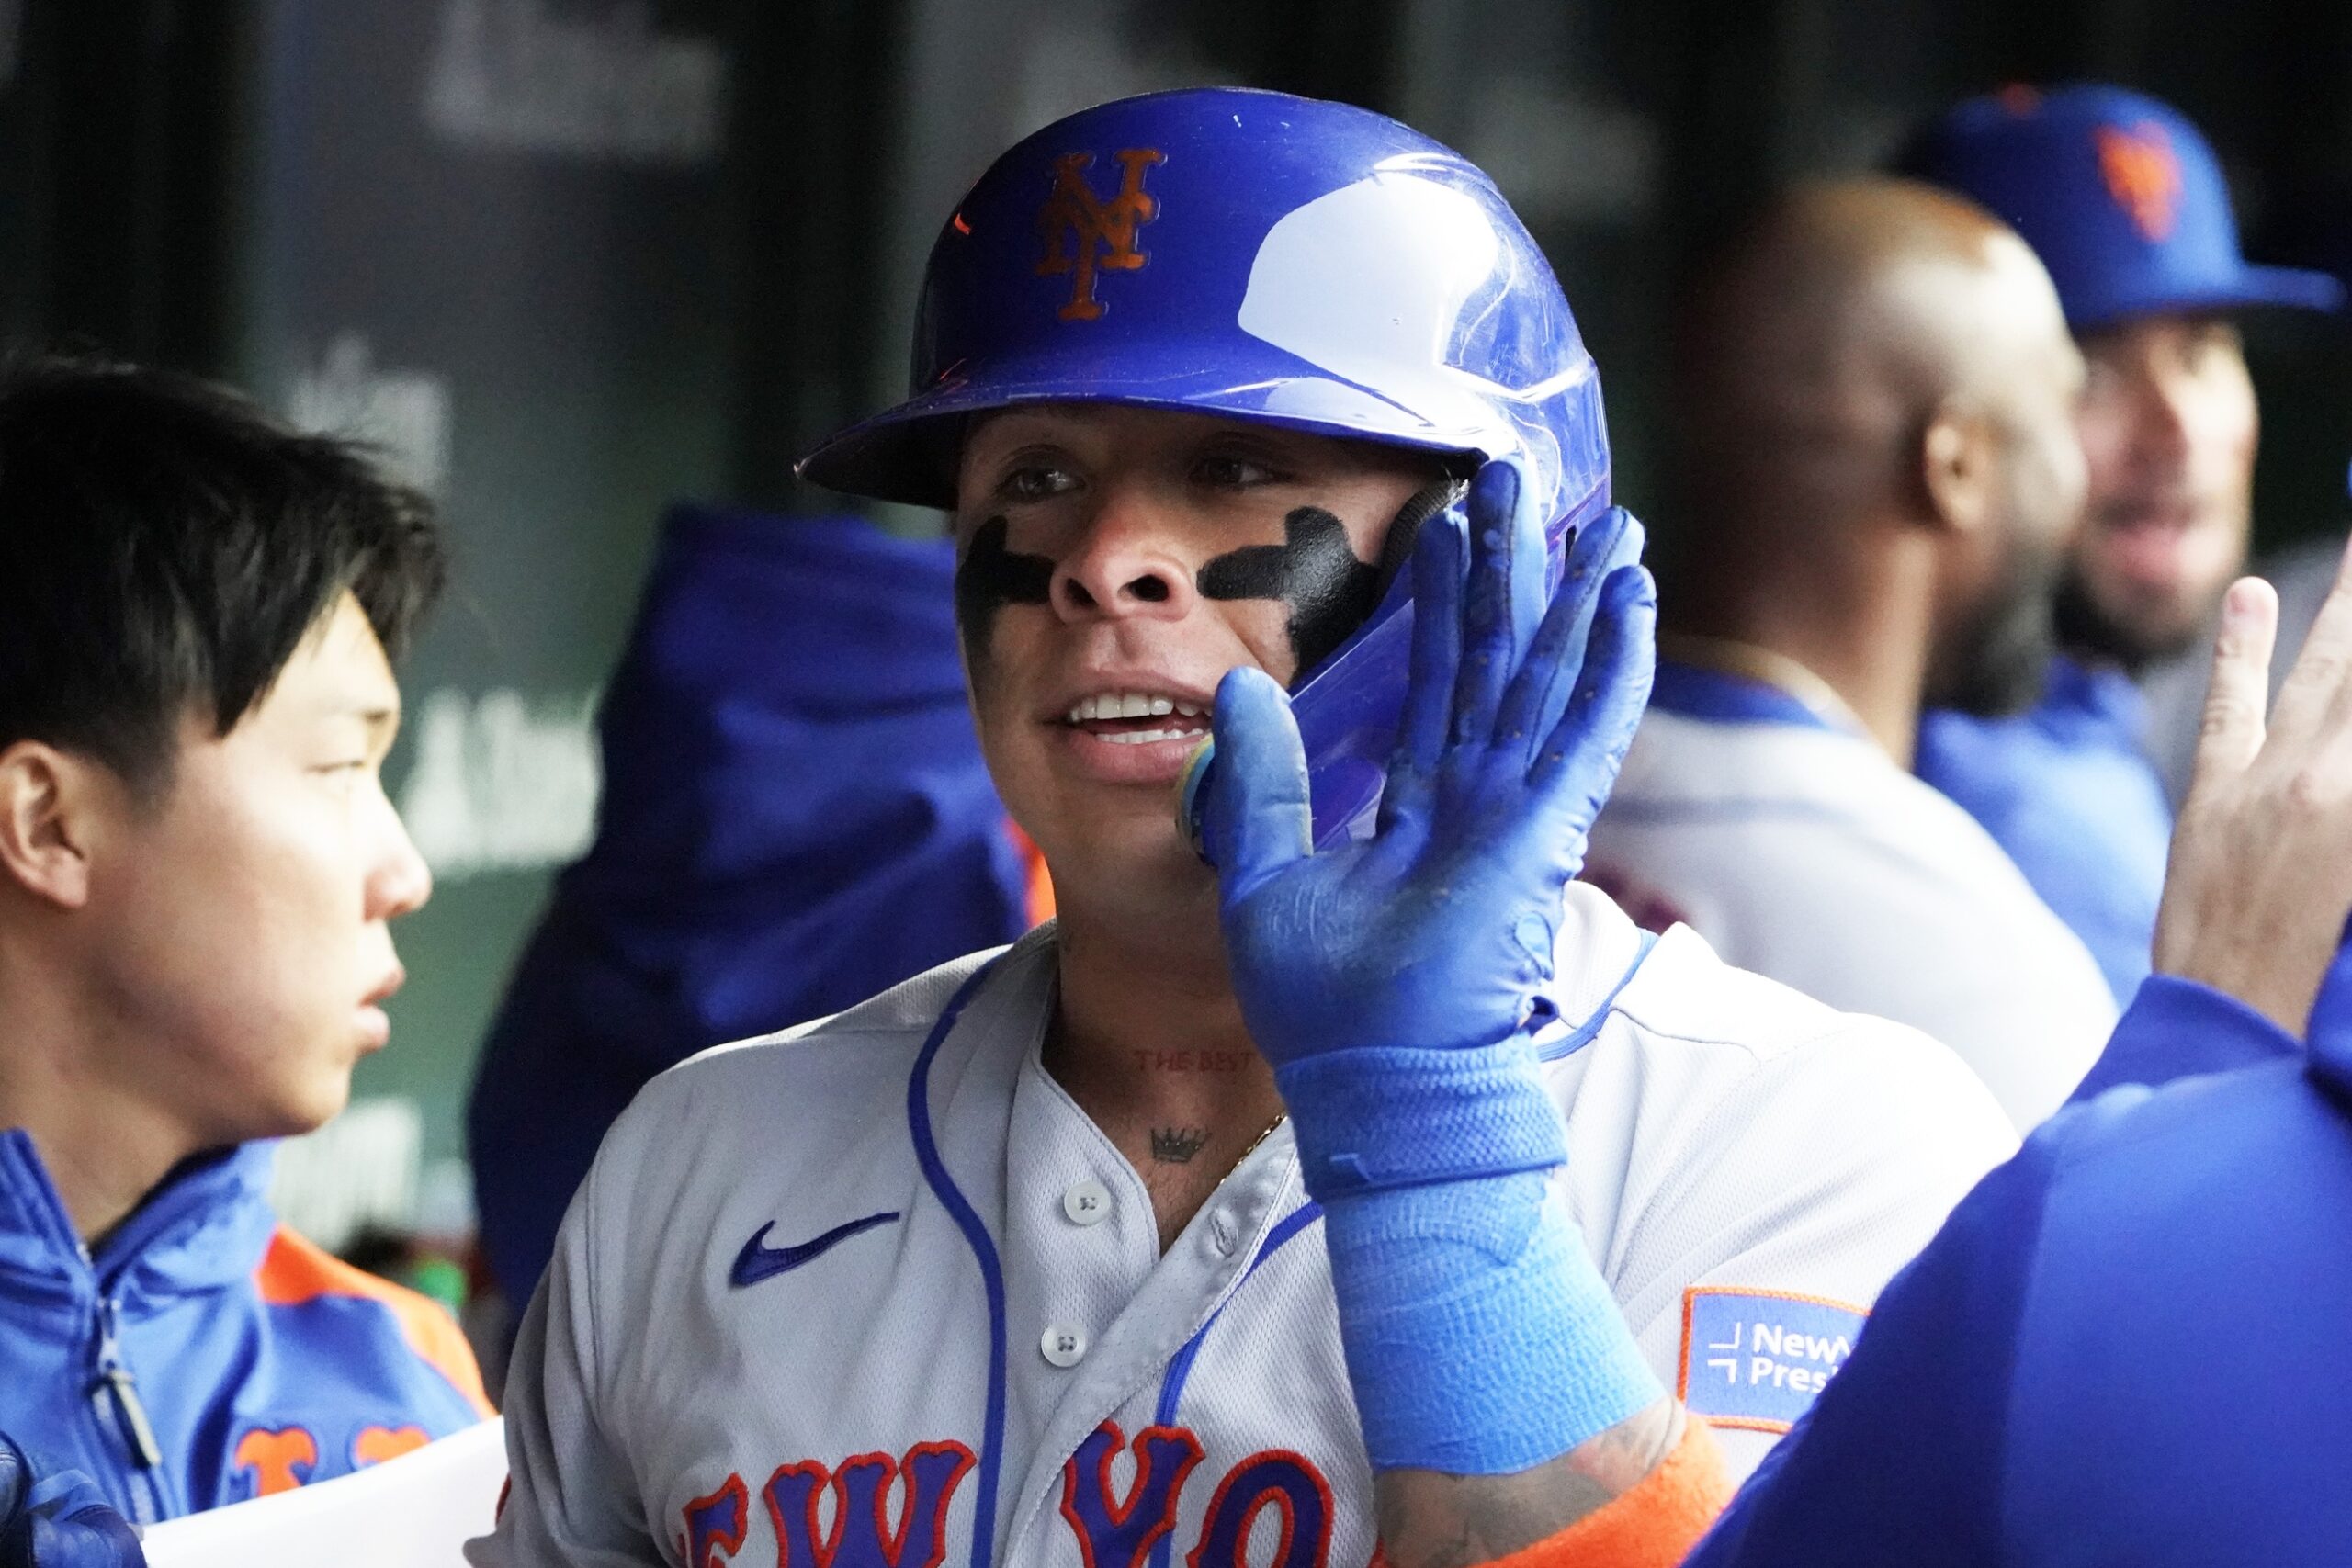
Francisco Álvarez. David Banks-USA TODAY Sports
Is It the Catcher?
Much has been made of Francisco Álvarez‘s framing skills so early into his young career, as he ranks in the 81st percentile in that category. Although Tomás Nido excelled in this area last season, placing in the 93rd percentile, he’s in just the 55th percentile this season. (Omar Narváez does not qualify.)
Perhaps Senga’s struggles with command mean that he relies more than other pitchers on great framing. Maybe his unorthodox pitching also makes it tougher for umpires to call his pitches, requiring greater presentation to call a strike. Or maybe he just needs his catcher to steal some strikes so he doesn’t end up walking too many batters.
Let’s take a look at each of his home and away games and the Umpire Scorecard from each. Although we will not be able to differentiate pitches thrown by Senga vs. those of the other Mets’ pitchers, perhaps this can give us some idea of whether the ball/strike calls had an impact on his games and if there was any difference by the catcher.
Note: the average accuracy for an umpire on called balls is 97 percent and on called strikes 88 percent. In other words, an umpire is far more likely to call a strike when the pitch is really a ball vs. calling a ball when the pitch is really a strike. This is likely due at least somewhat to pitch framing.
Home:
- Marlins (Nido): +0.36 runs; 99% called ball accuracy (CBA); 92% called strike accuracy (CSA)
- Nationals (Nido): +0.64 runs; 95% CBA; 87% CSA
- Rockies (Nido): +0.29 runs; 96% CBA; 88% CSA
- Rays (Álvarez): -0.32 runs; 95% CBA; 100% CSA
- Phillies (Álvarez): -0.32 runs; 96%89 CBA; 86% CSA
Away:
- Marlins (Nido): -0.16 runs; 95% CBA; 94% CSA
- Athletics (Nido): +0.7 runs; 96% CBA; 92% CSA
- Giants (Nido): +0.28 runs; 94% CBA; 81% CSA
- Reds (Álvarez): +0.08 runs; 98% CBA; 91% CSA
- Cubs (Álvarez): +0.33 runs; 97% CBA; 79% CSA
In most of the games that Senga pitched, the umpire’s calls actually benefited the Mets slightly in terms of run output. Only one time did a high-leverage missed strike call result in an at-bat where the opponent scored additional runs. There were other high-leverage strikes that were called balls, but the at-bats resulted in outs. Meanwhile, in Senga’s start against the Rays, Álvarez stole three crucial strike calls that were really balls.
Overall, in the games Senga pitched to Nido, umpires have averaged 95.8 percent called ball accuracy compared to 96.4 percent with Álvarez. They averaged 89 percent called strike accuracy with both Nido and Álvarez.
This analysis is imperfect due to the other pitchers involved, but there don’t seem to have been many high-leverage misses by umpires that clearly had an adverse impact on Senga’s pitching, specifically.
Home Support
Senga is new to the United States and not necessarily totally comfortable yet. There could be a psychological element here, that pitching in front of his home crowd with cheering gives him more energy. It is not statistically quantifiable, but perhaps this is a factor involved. It does affect some major league players in general, so it’s worth mentioning.
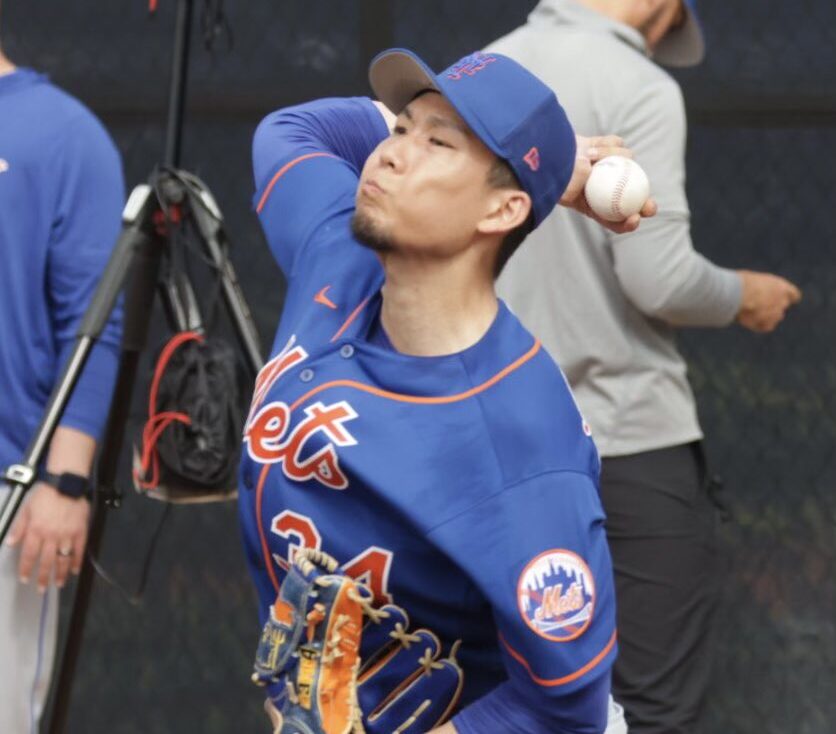
Kodai Senga. Photo by Ed Delany of Metsmerized
Pitching With a Lead
There is an interesting split in Senga’s overall numbers regarding whether he is pitching ahead, behind, or in a tie game, per Baseball Reference.
- Ahead (95 PA): .220/.326/.439/.765
- Tie (85 PA): .189/.294/.243/.537
- Behind (55 PA): .229/.327/.313/.640
There is a strange discrepancy in the slugging percentage of opponents when his team is ahead. This may be in part due to the 17-6 game against Oakland when Senga had a large lead after a few innings. However, it also may speak to his pitching mindset overall. Does he attack more with a lead?
The same split applies to situations of different leverage. (For an explanation of how Baseball Reference defines each type of leverage, click here.)
- High leverage: .216/.256/.297/.554
- Medium leverage: .162/.285/.238/.523
- Low leverage: .290/.397/.532/.930
Does Senga turn off the gas when the situation doesn’t mean as much toward the chances of winning? That could affect his numbers more than just the home/away splits.
For example, he pitched with a big lead against Oakland. He gave up four runs in the fifth after being staked to a 5-0 lead in the top of the fourth against San Francisco. He had a 2-0 lead against Chicago in the third and then promptly gave back three runs. In fact, the only one of his five road starts in which he didn’t have some sort of lead was against Cincinnati.
It’s hard to say definitively that this has an impact, but it could be at play more so than just where he pitches.
Kodai Senga. Photo by Ed Delany of Metsmerized
Small Sample Sizes
There is always the risk of drawing too many conclusions from small sample sizes. Although 10 starts may seem like a lot, 55 innings pitched is at most one-third of a full season’s workload. When we’re comparing 30 innings at home to 25 on the road, the statistical significance becomes even more dubious.
There must be more of a sample size before we can make any more definitive analysis. This is especially true for a pitcher who is new to the country and will be adjusting more than most as the season moves along.
Overall, I think that the most noteworthy thing to look at in Senga’s splits is not whether he is pitching at home or on the road, but the chase rates of his opponents. More specifically, take note of how often he gets swings-and-misses inside the zone, what happens on pitches out of the zone, and whether he can generate outs with pitches other than the ghost fork. This is what will likely correlate with his success or lack thereof far more than where he pitches.
It is still possible, and even likely, that Senga will have a higher ERA on the road than at home. After all, the Mets’ staff had a full run difference last season, and even deGrom himself saw a significant gap. Still, I would venture a guess that the discrepancy between home vs. road will not remain this profound unless he continues to face more free-swinging teams when he is pitching at home and more disciplined teams on the road.


