You know those people who say BABIP is a meaningless stat? They don’t know what they’re talking about. I know because I used to be someone who said BABIP was meaningless and I didn’t know what I was talking about.
Fangraphs defines BABIP as Batting Average on Balls In Play. It measures how often a ball in play goes for a hit. A ball is “in play” when the plate appearance ends in something other than a strikeout, walk, hit batter, catcher’s interference, sacrifice bunt, or home run.
I used to believe that BABIP was not a particularly “usable” stat because it seemed to fluctuate at the mercy of variables that were not necessarily controllable by the hitter or the pitcher. Defense, for instance, was problematic because if you happened to play in a division with some top tier defensive talent, outside of division BABIP comparables lose their utility. A batter’s quickness is also problematic because faster players will get on base more if all else remains the same. BABIP seemed to me to simply be a picture-on-a-wall stat undermined by contextual variables such as luck, quality of defense, speed and whether or not you play in pitcher friendly confines.
And luck is a funny thing in baseball. Players can and will sometimes experience incredibly unlikely and prolonged strings of good (and bad) luck, so it’s no wonder fans have concocted notions of invisible “baseball gods” doling out karma like fast melting soft-serve ice cream in hot waffle cones as the players exit the dugout. It’s true, baseball is littered with statistical aberrations. You might even argue it’s one of the things that make it so damned entertaining. Nevertheless, luck and karma notwithstanding, BABIP does have value in its own right.
The 2017 Mets were crappy on BABIP. They rolled to the finish line with a .286 BABIP, No. 27 out of 30 teams, right behind the Padres. Why is that bad? Well consider that this .286 consists only of balls in play, so foul pop-ups, strikeouts, and any other manner of out that does not involve a “ball in play” are not tallied. So yeah, .286 is not great. Now when you click on Mets individual BABIP leaders (with at least 150 ABs) here is what you see …
- Brandon Nimmo (.360)
- Michael Conforto (.328)
- T.J. Rivera (.318)
- Yoenis Cespedes (.316)
- Norichika Aoki (.315)
- Asdrubal Cabrera (.310)
- Juan Lagares (.309)
- Neil Walker (.286)
- Rene Rivera (.283)
- Lucas Duda (.278)
- Jay Bruce (.271)
- Wilmer Flores (.270)
- Jose Reyes (.263)
- Curtis Granderson (.251)
- Travis d’Arnaud (.250)
- Dominic Smith (.218)
Immediately, you notice that all the high BABIP players are quite young. The average age of the top four players on this list is 24.7, the average age of the bottom four is 30. But beyond that there don’t seem to be any patterns. T.J. Rivera and Reyes are both contact hitters but are on opposite ends of the BABIP spectrum. Then again, the average OBP of the top five players on the BABIP chart above is .343 but the bottom five are at .302, a 41 point difference. This is a significant split and the correlation between BABIP and OBP may be a topic for another day.
But for our purposes, namely determining whether BABIP has any broad applicable utility, there may be a plausible argument that younger players with high on base percentages tend to have a high BABIP (which would give BABIP value as a correlate to OBP – especially on a Sandy Alderson team). Does that mean that younger players tend to see the ball better and hit the ball harder? You can see where we might get into trouble – we just jumped to the conclusion that a high BABIP results from hitting the ball harder. Does it?
Intuitively you would say yes of course, it has to, but if we look at Hard Hit Ball percentage (Hard%) the same top five BABIP players above have a Hard% of 34.5 and the bottom five have a Hard% of 33.2, a marginal difference at best. In performing this comparison, however, a couple of things come to light. First, Smith, who had one of the lowest BABIPs (.218) had one of the highest Hard% at 37 percent, and secondly, the Mets, who had one of the lowest team BABIPs in the league, were pretty good at Hard% coming in eighth in the league with 33.5 percent.
So were the Mets unlucky as a team? And how is it possible that a guy like Smith can hit the ball hard 37 percent of the time and still somehow end up with a .218 BABIP? Is it because BABIP is purely based on luck and is maybe garbage as a stat? Nope. Smith really did hit the ball hard a lot, but he also had a traditional lefty shift against him in 72 (almost half) of his at bats, and in those at bats he hit a not robust .194, much more in line with his .218 BABIP.
Lets look at another season with a wide split between BABIP and Hard%. In 2016, Bryce Harper had a .264 BABIP with a 34.1 Hard%, and yet in 2017 he had a .356 BABIP with a 34.3 Hard%. Harper saw a 92 point increase in BABIP in 2017 but he didn’t appear to hit the ball any harder. How? Well, in 2017, Bryce Harper’s BABIP rocketed back up to .354 while his 2016 .271 mark was 105 points off his 2015 BABIP. Harper reverted back to his norm in a big way with 2016 looking like an outlier. What we see here is that BABIP is useful in one very important way — as a season to season predictor. It is a stat that becomes more useful and more robust as you increase your sample size.
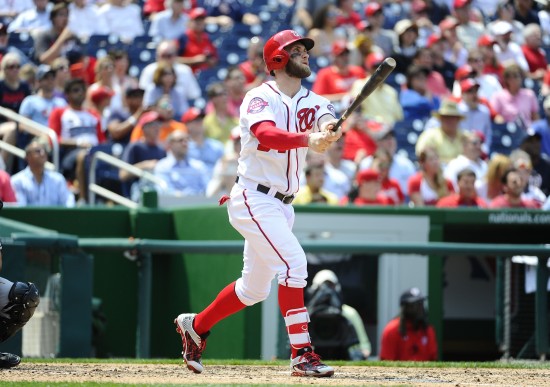
Because BABIP is susceptible to variables such as speed and defense and shifts and bad luck, a sample size of 100 at bats (or less) will not tell you much. In fact BABIP is probably more useful when looking at samples of 900 – 1,000 at bats over three seasons or more, in so far as it can strongly predict performance from there on. As was the case with Bryce Harper, no one could have predicted his 2016, but by the same token if you looked at his previous BABIP percentages, you would have clearly seen that 2016 was an aberration and that he was a pretty good bet to rebound, and sure enough, he did.
Dominic Smith’s sample in this sense is very small. However, given his lack of speed, his vulnerability to shifts, his home run totals, his Hard%, and his historically good plate discipline and high BABIP, coupled with what appeared to be some pretty bad luck, could be an excellent candidate for a significant rebound. His conspicuously low 2017 BABIP may act as a strong indicator here.
In three minor league seasons prior to his call up, Smith’s BABIP was .353 including a.380 BABIP in Triple-A. Now granted, it’s tougher to get hits in the majors, but a 162 point drop? Seems unlikely given his 37 percent Hard%. More likely, he was successfully shifted against, a lot, while experiencing his share of bad luck.
BABIP can be very helpful as a high-sample season to season stat that can predict what is perhaps an aberrant stretch (or season). You can look at Brandon Nimmo’s .360 BABIP and wonder if he will do as well next season with similar skepticism, but Nimmo’s three previous minor league seasons produced a combined .352 BABIP. So, unlike Dominic Smith, he’s not far off his career mark. And while Nimmo is faster, it is unlikely that Smith’s lack of speed would account for a 162 point drop in BABIP from Triple-A to the big leagues.
So there you have it folks, BABIP is useful if you have a large season to season sample as a baseline stat that can give you some substantive information on whether a player will revert to career norms — particularly in scenarios where hard hit ball % supports or is inconsistent with career averages. It’s a good way to spot what may be a fluke season or what may otherwise be a deviation from a player’s career trajectory, which is helpful in predicting regression or spotting bounce back candidates.


