The Mets acquired a trio of relievers last offseason to buttress the back end of their bullpen for the 2019 season. Jeurys Familia was brought back on a three-year deal, Justin Wilson was signed to provide stability to the middle of the group, and Edwin Díaz was traded for to solidify the ninth inning.
That plan didn’t work out. Familia’s 15.3 BB% was the highest of his career, Wilson was solid, but was also injured for a portion of the season, and Díaz eventually lost the closer’s role midway through the season.
The Mets bullpen finished the season well below expectations and Díaz was one of the main culprits. The 25-year-old righty was expected to anchor the unit, but finished with a 5.59 ERA, a 4.51 FIP, and a 0.0 fWAR.
So what went wrong with the 25-year-old right-hander? I looked into it last week and concluded that Díaz’s problems stemmed from his slider location.
But I wanted to delve deeper into Díaz’s profile and see if there was any other areas he could improve on in 2020.
Modern pitching metrics have revolutionized the baseball world over the last decade. Statistics like FIP, xFIP, and WPA have infiltrated the baseball landscape over the last decade, allowing player performance to be more predictive and fully encapsulating the value that a player provides. However: there’s a pretty big issue with using these metrics; they’re purely results-based.
What’s more important for a pitcher? Is it the result of the plate appearance or the physical movement of the pitch? Jason Wilson, Wayne Greiner and the team at Quality of Pitch argues it’s the latter.
There are four ways to analyze pitches through a pitch-by-pitch perspective: Pitch Quality, Pitch Deception, Pitch Assortment, and Pitch Sequencing. The team at Quality of Pitch, which serves both as the company name and the title of the metric, have attempted to quantify the first of the four perspectives.
Quality of Pitch was a metric created in 2008 by Jarvis Greiner and Jason Wilson, a couple of pitchers at Biola University. Most modern metrics, like wOBA, xwOBA, and even ERA, measure a pitch’s effectiveness by the result of the plate appearance. Quality of Pitch is unique in the fact in that it quantifies a pitcher’s value by each pitch thrown by the pitcher. Instead of calculating the run value of a single or a double and using that in the QOP formula, Quality of Pitch is taken completely context-free. These values usually fall in between three and six.
There are six components that are measured to calculate the Quality of Pitch.
- Total Vertical Break
- Late Vertical Break
- Horizational Break
- Closeness to the Edge of the Strike Zone
- Velocity
- Rise
Their algorithm awards pitches who meet these criteria. An example of this comes from the Quality of Pitch website.
A 2017 Hardball Times article looked into the correlations between Quality of Pitch and a variety of commonly pitching statistics. Jason Wilson, the author of the study, concluded that noiseless ERA (ERA stripped of context) and FIP decreased as Quality of Pitch increased. In addition, home run percentages tend to decrease as QOPA increase.
For reference, 2019 Cy Young Award winner Jacob deGrom had 4.40 QOPA(Quality of Pitch Average) in 2019. His fastball was middle-of-the-pack (4.35 QOPA). His other standout pitches include his slider (4.36 QOPA) and his change-up (4.69 QOPA).
Keep in note that QOPA doesn’t have a perfect correlation. A high QOPA value doesn’t directly lead to a low ERA. There are some pitchers that have outstanding seasons, but low QOPA scores. That being said, that’s not the point of the metric. It’s solely used to measure the physical movement of the pitch to determine its effectiveness. In an interview with MMO, Greiner claimed that 85% of pitchers who have both high QOPA and high ERAs see their ERA decrease in the ensuing campaign.
Below are Díaz’s Quality of Pitch percentiles from the 2019 season.
- Total Vertical Break: 5th percentile
- Late Vertical Break: 49th percentile
- Horizational Break: 53rd percentile
- Closeness to the Edge of the Strike Zone: 44th percentile
- Velocity: 99th percentile
- Rise: 67th percentile
Quality of Pitch didn’t grade either of Díaz’s primary pitches particularly well. His four-seam fastball came in at 4.00 and his slider finished at 3.40. For comparison, the 2019 average QOPA for fastballs was 4.47. For sliders, it was 3.91.
Looking into the components of what makes up the Quality of Pitch formula, I was able to determine why Díaz’s pitches don’t fare so well in QOP’s system. These percentile rankings are from the right-hander’s 2019 campaign.
Fastball:
- Total Vertical Break: 4th percentile
- Late Vertical Break: 86th percentile
- Horizational Break: 79th percentile
- Closeness to the Edge of the Strike Zone: 34th percentile
- Velocity: 98th percentile
- Rise: 17th percentile
Here we can see why QOP rates Díaz so poorly. Díaz only ranked above the 50th percentile on three of the six criteria that make up the QOP formula. While his fastball velocity is one of the best in the Majors, his vertical break and rise are among the worst marks in the Majors.
Slider:
- Total Vertical Break: 22nd percentile
- Late Vertical Break: 47th percentile
- Horizational Break: 5th percentile
- Closeness to the Edge of the Strike Zone: 35th percentile
- Velocity: 97th percentile
- Rise: 59th percentile
His slider numbers were particularly concerning as his final QOPA on his slider was the 21st worst mark in the league. Similar to the fastball, his slider velocity was top-notch, but the other components, like horizontal break and total vertical break, brought down his overall slider QOPA.
It’s also worth noting Díaz’s location rating of his slider. Although it seemed like his command of the pitch was lacking, that component’s actually misleading. Díaz threw his slider often in two-strike counts, utilizing it to get batters to chase. In order to do so, he threw the pitch out of the strike zone. So while QOP recorded his slider location as below-average, he utilized the pitch as intended.
As I looked at in my last piece, Díaz’s poor usage of his slider was a factor towards his horrific 2019 campaign. QOPA agreed with that statement, valuing that Díaz’s slider well-below the MLB average of 4.50. However, it saw a clear improvement mid-season. Before June 20th, Díaz’s slider had a QOPA of 3.12. After June 20th, QOP valued his slider at 3.39.
June 20 is a notable day in the 2019 campaign; the Mets fired Dave Eiland and promoted Phil Regan to take his place as the team’s pitching coach.
Since QOP measures the physical movement of the pitch, I wanted to take a look at Díaz’s production results-wise. While it’s not recommended to correlate the production of the reliever with his QOPA marks, I was curious to see if an increase in QOPA corresponded to better production.
Upon gaining the reins to the Mets’ pitching staff, Regan emphasized an increased usage of sliders. Pre-Regan, the Mets pitchers hurled sliders 15.9% of the time, resulting in a .319 wOBA, which was the second-worst wOBA in the league over that time frame. After Regan was hired, Mets hurlers threw sliders 21.2%, posting a .243 wOBA, the fourth-best mark in the league over that span.
Díaz took the teachings of ‘The Vulture’ to heart and the results showed. Before June 20th 2019, his slider had a xBA of .261. Post-Regan, it had a .183 xBA.
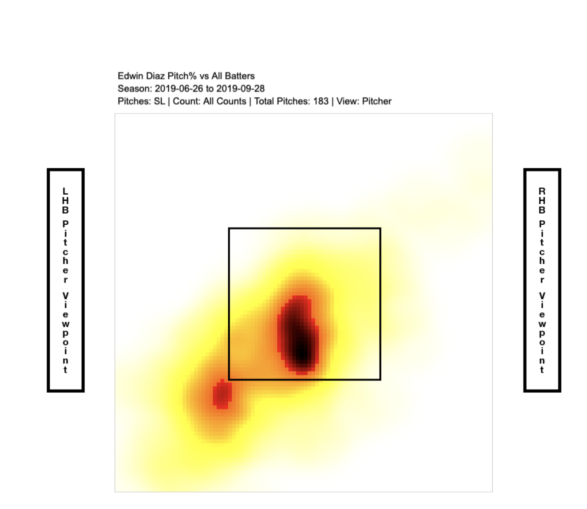
Although the horizontal/vertical break of Díaz’s slider didn’t change much compared to the first half over the season, it’s clear that he located it much better.
As we can see in Díaz’s heatmaps (via Fangraphs), he located his sliders more towards the lower third of the plate.
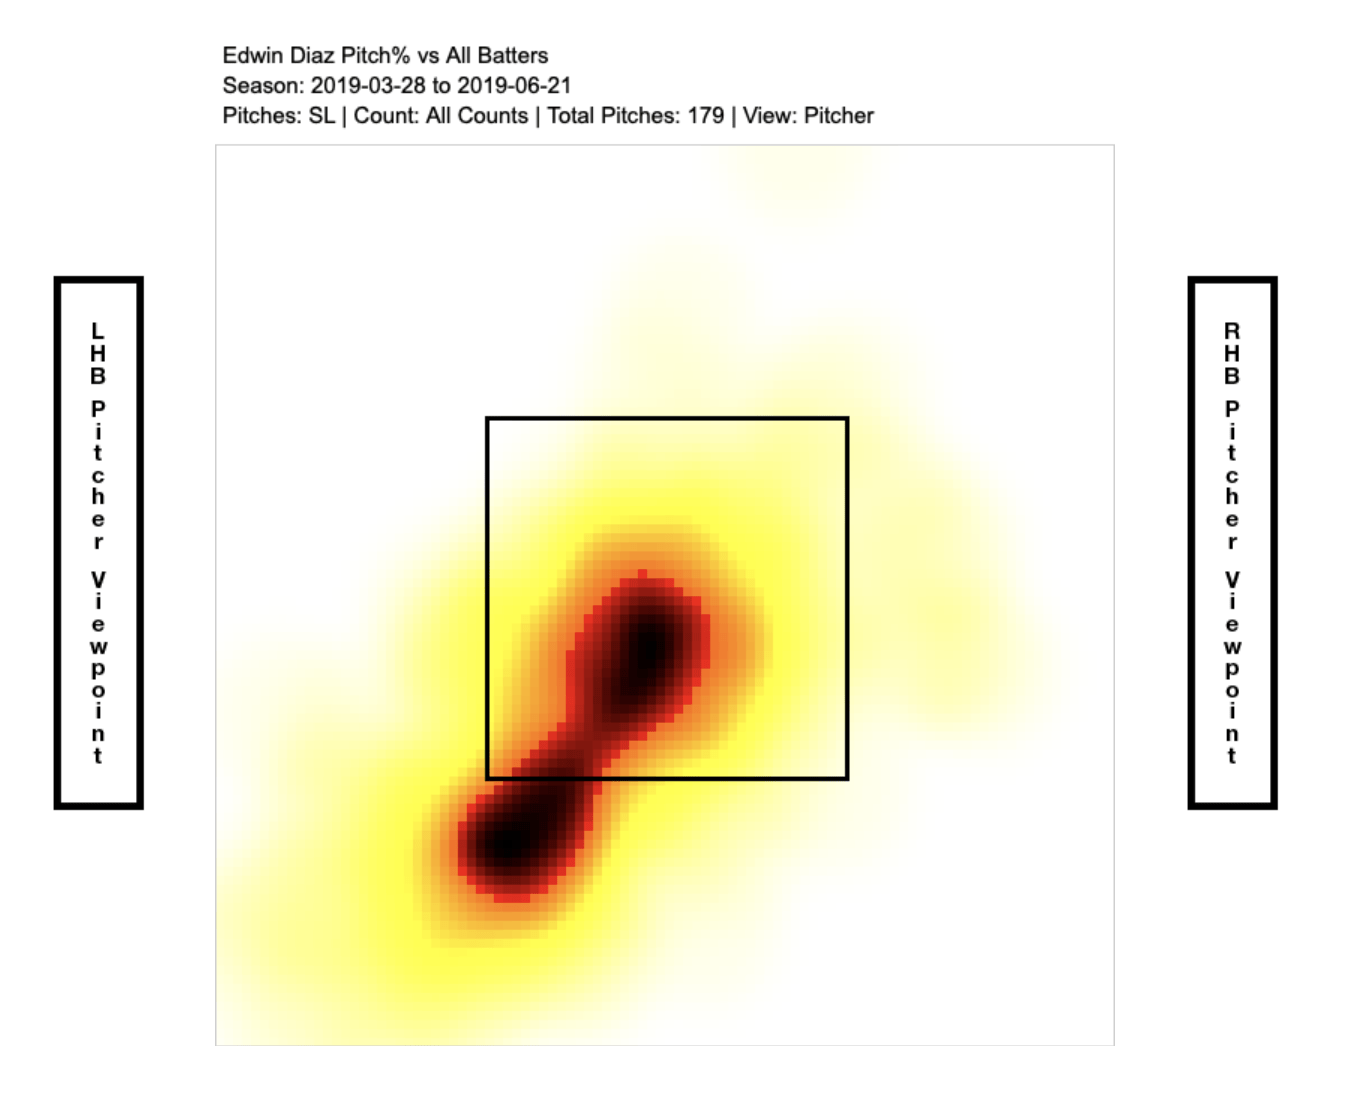
I used Fangraphs’ RAA/100 metric to analyze the value of Díaz’s sliders. I looked at his seasonal RAA/100. I then split the data into pitches before and after June 20th. Finally, I narrowed it down to the slider located in the lower third of the strike zone.
Díaz’s RAA/100 before June 20: -37
Díaz’s RAA/100 after June 20: -4
While the improvement was still below his 2018 standard, it was no doubt a step in the right direction. More pitches in the lower third of the strike zone led to fewer barrels and better exit velocities.
Here’s to hoping Jeremy Hefner can help Díaz’s rediscover his slider. If so, Jeurys Familia’s claim that the Mets have the best bullpen in the Majors might not be that hyperbolic.
Any questions about QOP? Leave them in the comments below or feel free to tweet at me @MattyCuso!


