The Robinson Cano/Edwin Díaz acquisition is already going down as one of the most one-sided trades in recent baseball history.
The Mets sent Jarred Kelenic, their recent first-round draft pick, packaging him with a couple of their top pitching prospects, in exchange for second baseman Robinson Cano and closer Edwin Díaz. Since the Mets took on most of Cano’s remaining deal, the Mariners received highly-paid veterans Jay Bruce and Anthony Swarzak as a form of salary relief.
So far, it’s pretty clear that Brodie Van Wagenen’s first big move as the Mets GM blew up in his face. Kelenic continued his assault on minor-league pitching and currently ranks among the top twenty prospects in the game. Meanwhile, Justin Dunn, one of the prospects that the Mets sent West, made his Major League debut in 2019 and should positively contribute to the Mariners’ pitching staff in 2020.
The two major-leaguers the Mets received didn’t fare well in their debut season in Queens. Cano floundered in his first year donning the orange-and-blue and doesn’t seem likely to drastically improve his performance in the coming years. However, the other piece that the Mets acquired in the trade seems primed for a rebound in 2020.
As Devan Fink of Fangraphs detailed in this excellent piece, it’s virtually impossible for Edwin Díaz to encounter worse luck in 2020.
Luck’s a fickle thing in baseball. Sometimes, players end up with 30-game hitting streak buoyed by a .427 BABIP; other times a 98-mph fastball on the black gets sent into the left-field bleachers. There’s nothing you can do about it and you never know when it’s going to change. Eventually, a player’s luck always to finds a middle ground.
Díaz still has a 97+ mph fastball with a 39% strikeout rate. With that velocity, it’s unlikely that 2020 will be a repeat of his ugly 2019 campaign.

Statcast Swing Take is the brainchild of Baseball Savant’s Tom Tango. It’s a way to measure batter success based on the swing and takes tendencies in four quadrants of the plate.
For a primer on Swing Take Profile, keep on reading. For a longer explanation, click here.
In Tango’s version of home plate, there are four distinct quadrants: the Heart Zone, the Shadow Zone, the Chase Zone, and the Waste Zone.
- The Heart Zone is located in the heart of the plate. 2019 average xwOBA: .376.
- The Shadow Zone shadows the strike zone. 43% of all pitches were thrown here during the 2019 season. 2019 average xwOBA: .263.
- Surrounding the Shadow Zone is the Chase Zone. Pitchers tend to use this zone to get opposing batters to chase pitches. Average 2019 xwOBA: .292.
- The final zone is the Waste Zone, which is used to “waste a pitch”. Average 2019 xwOBA: .436.
These images show Díaz’s 2018 and 2019 Swing Take Profiles.
2018:

2019:
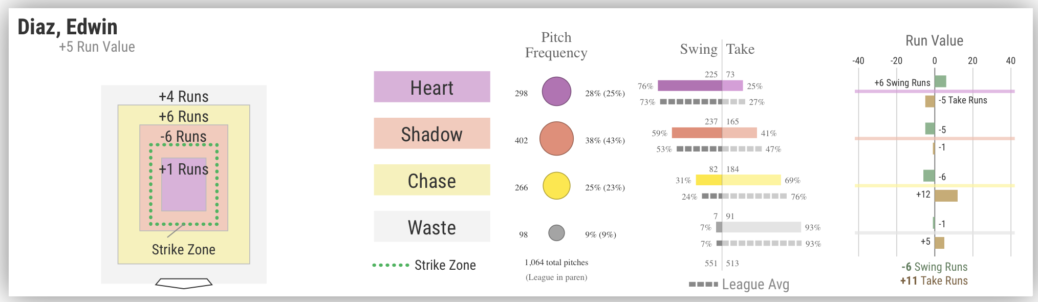
These images show how many Run Values Edwin Díaz gained or lost in each zone in 2019. Run Values are calculated by taking the outcome of a plate appearance and determining how many runs it is worth. Baseball Prospectus defines it as the “number of runs to score from a particular event based on historical context.”
A major difference between let’s say, J.D. Davis‘s profile and Díaz’s profile is that Díaz’s Run Values are negative while Davis’s are positive. Run Values are negative for pitchers since the more outs a pitcher gets, the lower the Run Values.
There’s a couple of major differences in Díaz’s Heart Zones and Shadow Zones that could help explain his 2019 struggles.
Díaz’s Run Values in the Heart Zone increased from -8 in 2018 to +1 in 2019. His Swing Runs in the Heart Zone also went up from -4 Runs to +5 Runs.
Looking into it more, I wanted to see if his type of contact allowed impacted his Swing Runs increase. I decided to look at his line-drives and fly-balls numbers as the Batted Ball Events (BBE) characterized as such had a .582 wOBA last year. Díaz permitted 49 line drives and flyballs on pitches in this zone in 2019, compared to 35 similar results in 2018. Correspondingly, his barrels allowed in the Heart Zone rose from 4 to 11.
There was also a drastic increase in Díaz’s Run Values in the Shadow Zone. His -21 mark in 2018 was easily his best mark in his Swing Take Profile, but in 2019, it increased by 15 runs to -6. Although batters swung six percent in this zone more than the league average, it was unchanged from his 2018 mark.
His 2019 Swing Runs Value numbers in the Shadow Zone tanked, going from -19 Swing Runs in 2018 to -5 Swing Runs. However, the underlying reason for his increase in Runs in the Shadow Zone differed from his issues in the Heart Zone.
Díaz lost Runs in the Shadow Zone, not because of his skill, but rather, a factor he couldn’t control. His xwOBA in the Shadow Zone was virtually unchanged. Sure, his exit velocity and launch angle ticked up, but that wasn’t enough to warrant a .115 wOBA increase. His struggles were related to another phenomenon which I touched upon earlier in this article: luck.
There’s no perfect calculation that can totally encapsulate the amount of luck a player encounters, but there’s a number of metrics that can give some sliver in understanding if a player’s production is sustainable. One of the metrics I use to measure “luck” is HR/FB%. Fangraphs describes it as “the ratio of home runs a player hits out of their total number of fly-balls.” It’s calculated by taking the total amount of home runs a player hit and dividing it into the total amount of fly-balls hit.
HR/FB% is used to show if a home-run ratio is sustainable. The 2019 MLB average was 15.3%.
The average HR/FB ratio for all BBE located in Shadow Zone in 2019 was 18.8%. Díaz’s 2019 HR/FB ratio on pitches in the Shadow Zone: 40%. That’s ridiculously high and was a major contributor to his also-inflated .318 BABIP. For comparison, Díaz in 2018 had an 8.3% HR/FB rate along with a .211 BABIP.
With that being said, these numbers were taken from a small sample size. However, the advantage of the data being extracted from the small sample size is that it should begin to stabilize. With a larger sample size, his HR/FB% rate should begin trending in the opposite direction in 2020.

It’s also interesting to note Díaz’s year-over-year decline of swinging strikes in the Shadow Zone.
In 2018, Díaz had one of the most effective sliders in the game. It dominated opponent batters to the tune of a .190 wOBA and had a 29.1% SwStr%. That slider was particularly effective in the Shadow Zone (0.070 wOBA and a 40.9% SwStr%).
However, his slider didn’t enjoy the same success in 2019. Overall, it had a .387 wOBA and a 23.7% SwStr%. In the Shadow Zone, his wOBA jumped almost 150 points to .337 and his SwStr% fell to 30.7%.
Since the Shadow Zone borders the Strike Zone, I think it would be safe to assume that pitches in the Shadow Zone would induce plenty of swings and misses. In Díaz’s 2018 season, he generated 111 swings-and-misses on pitches in the Shadow Zone. In 2019, it fell to 93 swinging strikes in The Shadow Zone.
In the Chase and Waste Zones, there wasn’t a ton of discrepancy compared to his 2018 numbers. The only major divergence from his 2018 numbers was that batters posted three more Swing Runs against Díaz in the Chase Zone.
Improving in the Shadow Zone is the key to Diaz’s 2020 success. If he can improve in that area, he could easily transform back into a dominant bullpen arm. However, if he doesn’t, the Mets will need to seriously consider finding a ninth-inning replacement.


