
While perusing Baseball Savant at 1 a.m. a couple of nights ago, just like any normal quarantined college student would be doing, I came across Marcus Stroman‘s profile. Fiddling around with the columns, I noticed Stroman has done particularly well in MLB.com‘s sweet spot metric (SwSp%) throughout the last few seasons.
Upon closer look, I noticed that those who finished top-10 in the sweet spot percentage weren’t baseball’s best pitchers. It was the Ross Stripling‘s and the Dallas Keuchel‘s of the world. Pitchers that are undoubtedly above-average, but aren’t considered elite. That intrigued me.
If Stroman finished among the best in the Majors in this metric, well, why hasn’t he joined the rank of MLB’s aces?
Stroman’s no-doubt an above-average pitcher, but his performance hasn’t warranted being mentioned in the same company as Jacob deGrom and Max Scherzer (not yet, at least).
But that’s not saying his sweet spot percentage is completely useless. It’s actually really neat. Sweet spot percentage measures which pitchers have allowed the optimal launch angle on their batted balls. This angle range falls between 8˚ and 32˚. As Ben Clemens of Fangraphs explored in this piece, this angle range produced a .732 wOBA in 2019.
Stroman’s 27.4 SwSp% ranked tenth in the majors in 2019. This means that only 27.4% of batted balls he allowed fell into that aforementioned danger zone between eight and 32 degrees. For the full leaderboard, click here.
But there’s a huge issue with this metric; it’s biased towards ground ball pitchers. Since ground ball pitchers induce plenty of BBE’s below the eight-degree threshold, it’d be surprising to see a SwSp% leaderboard not populated with them.
So SwSp% incorrectly values Marcus Stroman. That had me wondering if there were any other sabermetrics that are inaccurate in their evaluation of Marcus Stroman?
There’s a couple of metrics that I’m explored:
- xwOBAcon
- Barrel Percentage
xwOBAcon: For those unfamiliar with the metric, xwOBAcon calculates the expected wOBA on contact, taking into account the contact aspect of xwOBA and removing walks, strikeouts and hit by pitches. xwOBA measures the expected production of a batter, using a launch angle value and an exit velocity number, among other things. It can be used to measure the expected production a pitcher allows.
If, let’s say, Freddie Freeman hits a flyball off of Jacob deGrom that travels 100 mph at a 25˚ launch angle into right field. Since it was hit right at him, Michael Conforto casually reaches out and catches it. Freeman’s stats would simply reflect a flyball to right field. But xwOBA and xwOBAcon would credit Freeman for a ball well-struck and debit deGrom for allowing hard contact.
xwOBAcon works on the same scale as wOBA and xwOBA. The smaller, the better. The average across all major leaguers in 2019 was .369.
Although xwOBAcon’s exact equation is proprietary, it is public knowledge that it’s calculated using a launch angle value and an exit velocity number.
In the cases of Stroman and other ground-ball pitchers, their xwOBAcon marks could be skewed due to the low launch angle allowed. Since ground ball pitchers induce plenty of low launch angle BBE’s, their xwOBAcon marks are usually lower than the average pitcher. If we look at it from a statistical point, there’s really a poor correlation between GB% and xwOBAcon.
Stroman finished 2019 with a .337 xwOBAcon and ground-ball rate of 54.6%. The average launch angle on Stroman’s ground balls came in at -15.1˚, which explains his low xwOBAcon value.
Since xwOBAcon is a major component of the xwOBA equation, it also raises the question if xwOBA is a poor metric to grade Stroman by. But that’s a question for another day.
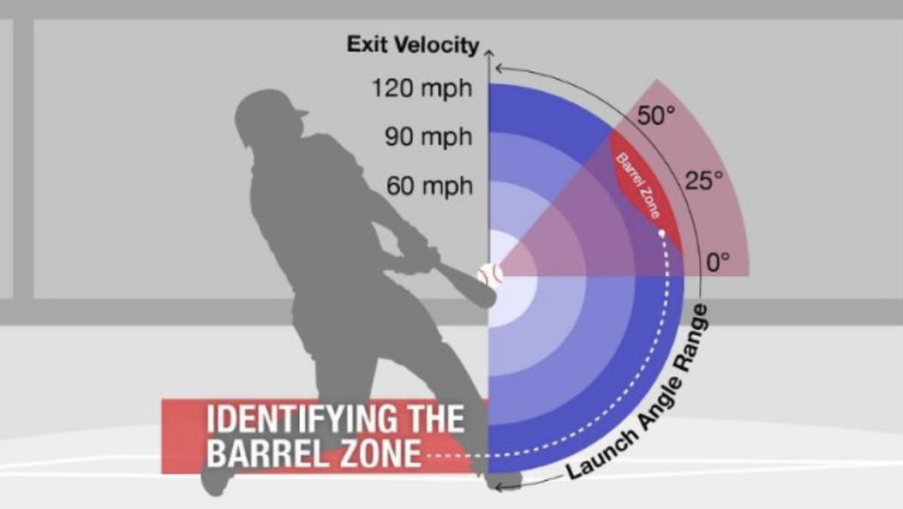
Barrel Percentage: Again, a quick explanation for those who are unfamiliar with barrels. Barrels are classified as BBE’s (batted ball events) that are classified as hard-hit and have an optimal launch angle. Barrels have been proven to be both a descriptive and a predictive metric, which makes it extremely helpful.
For those are visual learners:
Stroman’s 2019 barrel per plate appearance ratio was a mere 3.0%, 18th in the majors.
Still, looking into the under-the-hood components of this metric, it’s clear that xwOBAcon and Barrel Percentage face the same issue. Both metrics take launch angle into account. While Barrel Percentage is undoubtedly helpful to evaluate many pitchers, it seems like Stroman might be an outlier.
This disparity between Stroman’s Statcast metrics and actual results doesn’t mean that these metrics are valueless. All it means is that the Mets starter is exceptional at limiting hard contact. But it’s interesting that it doesn’t translate to his on-the-field results. Stroman’s simply an outlier, which will happen with every metric. Sometimes the stars don’t align and there’s a player that’s in a high percentile in xwOBAcon, but falls in the middle of the pack when it comes to ERA.
xwOBAcon and Barrel% are great in context. They measure the type of contact pitchers allow. In the case of Marcus Stroman and other ground ball pitchers, they fulfill their job. They tell the story of what they need to tell. Yet it’s unfortunate that those results are not indicative of his true performance. When it comes to that, wOBA’s a better metric to use in this case. His .300 wOBA was tied for 44th in the game, which isn’t bad by any means, but doesn’t rank him among the top hurlers in the game.
I did not write this article to say that analytics are bad, because that is certainly not the case. Rather I wanted to show how they can sometimes be misleading, particularly exploring the Statcast metrics that love Marcus Stroman. Some pitchers succeed by striking the world out; others do it by inducing poor contact. It seems like Stroman falls into the latter category.
Hopefully, as tracking technology improves, better statistics will be created that accurately grade every pitcher’s performance. But until then, it is important to know the limitations that certain metrics have.


