Baseball has not been easier for pitchers over the last few years. Home runs have sailed out of ballparks at all-time highs, record exit velocities have been set, and there have been rumblings throughout the industry that the physical composition of the baseball has changed. Many pitchers have complained about the new physicalities of the ball, claiming that it’s been more difficult to throw effective breaking balls.
There have been multiple attempts to investigate this rumor. Ben Lindbergh of The Ringer looked into the phenomena in 2017, concluding that the seams were lower and 2019’s ball was smaller than the typical baseball. This past summer, Dr. Meredith Wills of The Athletic reexplored the issue and agreed with Lindburgh’s verdict.
The changes to the baseball have led to decreased effectiveness of offspeed pitches. Since the seams are lower on the ball, pitchers were unable to properly grip their offspeed deliveries. The seams also make it more difficult to control and move the pitches.
But for batters, these last few seasons have been heavenly. Since the seams were lower and the ball was more spherical, it faced less resistance when it was sent into the atmosphere. Since fly-balls faced less resistance in the air, balls were sent further. A quick query on Baseball Savant confirms this theory. The average fly-ball distance increased from 315 feet in 2015 to 323 feet in 2019, with the year-over-year total averaging an increase of more than 1.5 feet a year.
2019 was a pretty dreadful year for pitchers. Teams hit a combined 6,776 home runs, shattering the previous record by over 550. Going into the 2019 season, the team home-run record was 267, which was set by the 2018 Yankees. Four teams surpassed that total in 2019.
While a lot of work has been done in identifying the issue with the ball, there have not been many publications that analyzed which player’s production benefited the most. That’s where Connor Kurcon and Ray Bulter’s latest article comes in.
Kurcon and Butler wanted to see which ballplayers were affected the most by 2019’s “juiced” ball. He did so by taking the exit velocity and launch angle of similar BBE’s (batted balls events) and inspecting at their respective wOBAcon numbers. They then adjusted the wOBAcon marks to account for which hitters enjoyed better-than-expected success based on their exit velocities and launch angles. The full piece, which fully explains the calculations, can be found here and is well worth your time.
Using Kurcon’s data, I created a Google Sheet that displays the Mets data from the 2019 season, which can be found here. Hitting data is on the first sheet and the pitching data is on the second one.
Expect More from Edwin
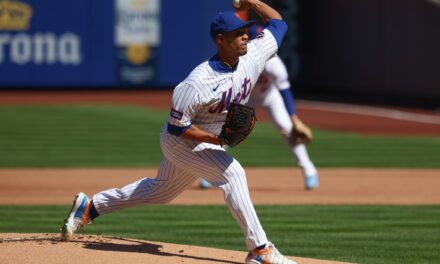
To put it lightly, Edwin Díaz’s 2019 season wasn’t pretty. He emerged from mediocrity to save 57 games for the Mariners in 2019, skyrocketing both his status and his trade value. The Mets were able to put together a prospect-rich package to acquire the young righty over the offseason. However, he couldn’t come close to replicating his 2018 production, eventually losing the closer’s role in mid-July.
Nonetheless, Díaz’s peripherals in 2019 were encouraging. It’s not often a pitcher posts a 39.0 K%, a 3.07 xFIP, and a .377 BABIP, but finishes with an ERA over 5.50. Last week, I took a look at Díaz’s issues and concluded that Díaz was plagued by consistent unluckiness. Kurcon’s data supports this conclusion.
Díaz’s 2019 change in wOBAcon was the eighth-highest in the game while his Benefit Balls/BBE placed him 21st. Benefit Balls are defined as BBE’s that were hit in the 95-105 mph range, which was proven to have the greatest year-by-year wOBA increase.
Although his wOBAcon was the eleventh-highest in the league, his adjusted wOBAcon opined that he was unlucky to receive that mark. Both can be true. Díaz gave up plenty of hard contact last year, but, still, he was unlucky to allow the damage that he did.

Pete Alonso‘s Power is Legit
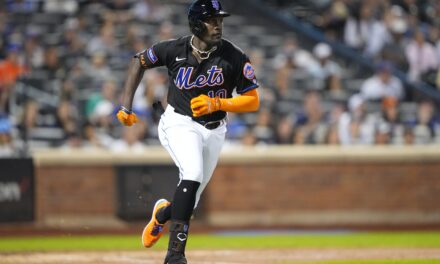
Alonso came to the Majors with plenty of well-deserved hype. Hitting home run straight-away to center field off a 104-mph fastball will definitely raise some eyebrows. While few questioned his ability to hit homers, no one expected him to break the Mets’ home-run record and pass Aaron Judge‘s rookie home-run rookie. Now, the only question going in the 2020 season is if this production is sustainable.
Kurcan’s data believes it is. Alonso’s 6.70% Benefit Balls/BBE was well below the MLB average of 8.58 while his wOBAcon change was a mere .006. When you compare these numbers with his exit velocity marks (average: 90.6 mph, max: 118.3 mph), it looks extremely likely that Alonso will continue that production in 2020.
J.D. Davis‘s Breakout
Davis’s situation is somewhat similar to Alonso’s. Both players entered 2019 with strong minor-league pedigrees, but there was no guarantee that their tools would translate to the Majors. Davis broke with the team with little fanfare, but quickly won over the hearts of the Mets fans with a knack for clutch hitting. Still, Davis has his doubters. His .335 BABIP and 47% ground-ball rate don’t exactly scream sustainable production.
But the fact remains that Davis hits the ball hard. His 91.4 exit velocity ranked in the 90th percentile among all qualified Major- League hitters. Furthermore, Kurcan’s data backs up Davis’s breakout campaign. There’s only a minuscule .008 difference between his adjusted wOBAcon and his actual wOBAcon.
Fun Fact
Among all Major League pitchers with over 50 BBE’s, Luis Avilan‘s 1.10% Benefit Balls/BBE ranked as the fourth-lowest. Bet you didn’t expect that.


