There’s no baseball right now, and by the looks of recent CDC recommendations, baseball won’t be coming back anytime soon. So with all this free time on our hands, it’s more of an opportunity to look back on the most recent decade of New York Mets baseball even more than we already have.
Although the Mets spent about half the decade in rebuild mode before reaching the playoffs in 2015 and 2016, the focus of this entire period of time was pitching, and, more specifically, the starting rotation. There had been some occasional bumps in the road, but this area of New York’s roster has been a strength more often than not in the not-too-distant past.
The expectations remain the same for this upcoming season, if it ever gets off the ground.
Upon looking at how Mets hurlers have performed in recent years, I was curious as to which pitchers owned the most valuable offerings for specific pitches. I determined this by looking at all qualified players (relievers are people, too) and the corresponding pitch value on a per-100-pitch basis, which is supplied by FanGraphs. I decided to limit the search to the four types of pitches — fastball, slider, curveball, and changeup — along with listing out the top five for each.
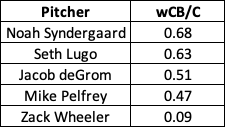
Fastball
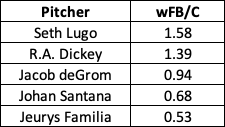
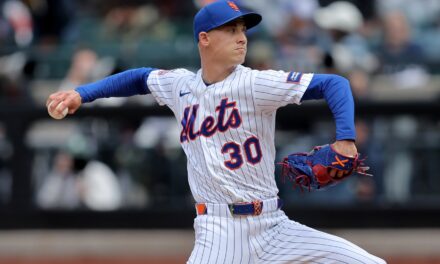
Right off the bat, it’s interesting to see two pitchers — Seth Lugo and R.A. Dickey — at the top of the fastball category despite not being particularly known for throwing the cheddar. This more pertains to Dickey because of his knuckleball, which obviously made a fastball in the low-to-mid 80s seem like it was going a million miles per hour.
Through his first three big-league seasons, Lugo’s fastball usage rate consistently went down. It shot up this past year from 48.9% to 56.9%, which coincided with a career-high average velocity of 94.4 miles per hour. This offering in particular produced career-best numbers in opponent wRC+ (32) and strikeout rate (45.1%) in 2019.
Notice Jacob deGrom coming in at number three — he doesn’t top any one category here, but he’s a consistent presence throughout, which isn’t shocking in the slightest.
Slider
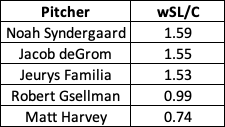
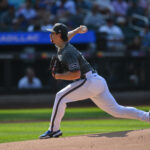
Even with the struggles he went through with his slider last season, Noah Syndergaard comes out on top in what ended up being a lot closer of a race than one would’ve expected for this pitch. It would’ve been interesting to see just how far ahead Thor would’ve finished from the pack if he produced his typical results with this offering. Between 2015 and 2018, the pitch value of his slider on a per-100-pitch basis read as the following: 1.20, 2.37, 2.94, and 1.55. This past season, though? It settled in all the way down at 0.38.
DeGrom makes a second appearance, which is expected because of his current stretch of dominance for the past two-plus years (and I just told you to expect seeing him more). The right-hander’s slider usage has increased exponentially since 2015 (15.8%, 18.5%, 22.7%, 23.9%, and 31.5%). The value of this offering has consistently stayed above 1.00 throughout that period of time, but the past two seasons have hovered around 2.00 (2.08 in ’18 and 1.97 in ’19).
Curveball
The irony continues. Guessing that Syndergaard owned the most valuable fastball of the decade and Lugo owned the most valuable curveball of the decade would’ve been far from outrageous. Yet, here we are with each of the leading the opposite categories. Baseball, man — gotta love it.
In order to see that increase in fastballs mentioned above, Lugo’s curveball usage took a nosedive between 2018 (31.9%) and 2019 (23.7%). The good part is its effectiveness didn’t also go downhill. While opponent wRC+ went from 31 to 40 during this period of time, the reliever’s walk rate (3.7% to 0.0%) and strikeout rate (25.7% to 32.9%) significantly improved.
Is it weird to have Syndergaard top this particular list? Possibly, but his usage of the pitch has actually been the most consistent of any in his arsenal. After tossing it at a 22.0% clip as a rookie in 2015, his usage has fallen between 8.5% and 10.5% each year since.
Changeup
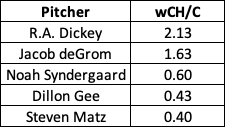
It’s tough having Dickey at the top here because he tossed his changeup at just a 1.0% clip. That’s also why pitch values on a per-100-pitch basis were used for this exercise — to even out the playing field when it came to usage. However, we can probably give the de facto crown to deGrom in this instance as he’s in his own league when it comes to changeup value in a Mets uniform recently.
His usage has been right at 16.0% in each of his Cy Young seasons, and the value on a per-100-pitch basis has easily surpassed 2.00 in each instance (2.48 in ’18, 2.15 in ’19). Although opponent wRC+ went from 10 to 29 during this period of time, deGrom kept his walk rate under 3.0% while increasing his strikeout rate by more than 10 percentage points to 39.7% last season.
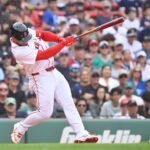
Steven Matz showing up at the bottom of this list is also intriguing. After all, I just wrote about how I think it could be a key component of a breakout campaign for New York’s lone left-handed starting hurler.
Let’s hope that whenever the Mets do get to take the field on a regular season game again, the current group of hurlers gets this new decade off to a fast start when it comes to pitching performances.


