Francisco Lindor had a far better year for the Mets in 2022 than in 2021.
Right?
… Not so fast.
If you look at “the analytics,” several of Lindor’s advanced metrics were actually better, at least percentile-wise, in his first year with the Mets than his second. Still, he recorded 4.2 fWAR in 2021 vs. 6.8 fWAR in 2022, reflecting the massive leap in performance that was visible to any fan. His wRC+ also rose from 103 to 127, meaning that he went from essentially a league-average hitter to one significantly above average.
Why, though? What changed in Lindor’s hitting profile that caused him to record better outcomes despite a worse process in a number of ways?
Hard Hitting
Almost all of Lindor’s hard-hitting metrics were higher in 2021 than last season, starting with hard-hit rate itself. In 2021, Lindor’s hard-hit rate was 44.1%, which was in the 71st percentile among hitters; in 2022, his rate went down to 41.3% and the 58th percentile. His average exit velocity reduced from 90.7 mph (75th percentile) to 89.3 (55th).
Couple that with a significantly lower sweet-spot rate, from 35.6% to 29.2%, and an xSLG that dropped from .453 to .427, and it’s astonishing that Lindor’s hitting production was seemingly so much better in 2022. How did that happen?
BABIP
BABIP is considered by many to be a luck-based stat. Once the ball leaves the bat and is put in play, a league-average BABIP is around .300 in any given season. (This is why Zack Wheeler and Spencer Strider accused the Mets of getting lucky last season, claiming that their team BABIP was .330; in fact, it was .302 at the time.)
In 2021, Lindor’s BABIP was .248, which was the lowest mark of his career by nearly 30 points. In 2022, that rose to .301, which was his highest mark since 2016 (.324).
Does this mean Lindor simply got luckier than usual in 2022?
Not necessarily, when you consider that his hitting approach changed. Lindor’s zone contact rate rose from 82.4% to 85.5% in 2022; increasing contact on pitches within the zone would tend to produce better hitting results. Although Lindor chased pitches more often in 2022 than in 2021—29.9%, up from 26.2%—that speaks to his approach outside the zone and would somewhat explain why his walk rate went down to 8.4% from 11.1%. However, within the zone, Lindor did a better job identifying pitches.
Furthermore, Lindor reduced his first-pitch swing rate from 30.6% down to 23.7%. He made more of a conscious effort to work the count despite taking fewer free passes. Instead, he did a better job of getting to balls within the strike zone.
The Mets as a whole adjusted their hitting approach to match their ballpark in 2022, emphasizing better run contact over trying to hit the ball out of the park. Lindor exemplified this philosophical shift, and it showed.
Four-Seam Fastballs
Lindor faced a similar rate of standard four-seam fastballs in 2021 and 2022. However, he put up 18 Run Value (RV) against them last year vs. eight the season prior. Part of that was due to a nearly 200-pitch difference in total fastballs faced, but it was also because his slugging percentage rose from .483 to .607 against them.
Interestingly, his xSLG was higher in 2021—.528 vs. .514—which would seem to indicate bad luck in 2021 and extraordinarily good luck in 2022.
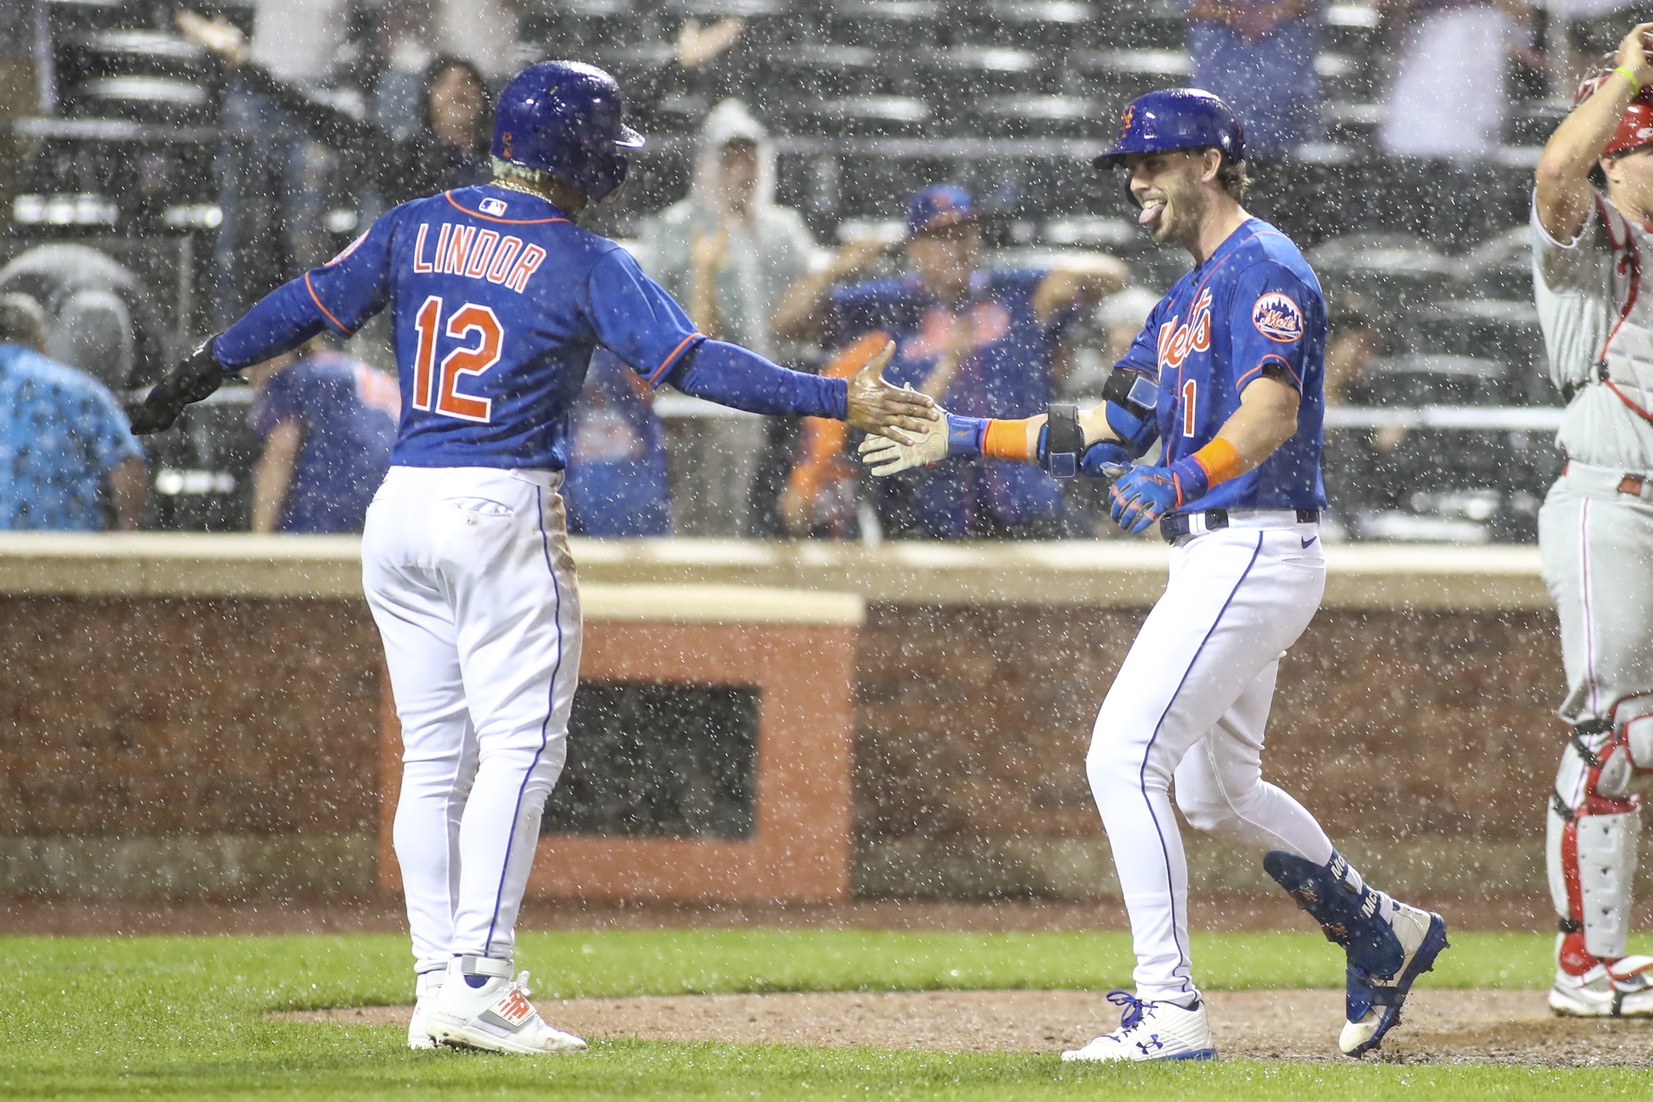
May 28, 2022; New York City, New York, USA; New York Mets left fielder Jeff McNeil (1) celebrates with shortstop Francisco Lindor (12) after hitting a three run home run against the Philadelphia Phillies in the fourth inning at Citi Field. Mandatory Credit: Wendell Cruz-USA TODAY Sports
The McNeil Effect
Jeff McNeil is known as an analytics anomaly. His numbers are consistently far higher than his expected metrics, mainly because his hard-hit rates are low. However, he continually defies the odds, recording a batting average that was 35 or more points above expected and a slugging percentage that was at least 45 points above expected in four out of his five MLB seasons.
Many Mets hitters followed the McNeil seeing-eye approach in 2022. Brandon Nimmo outperformed his xSLG by 24 points and his xBA by 13. Mark Canha was better by 21 and 41 points in each of those categories, respectively, and Starling Marte by 16 and 40 points. It’s not too surprising, then, that Lindor outperformed his expected metrics by 16 and 22 points in those areas.
To be sure, this is not the analytical approach to baseball. The current mentality is to emphasize pull hitting, exit velocity, and launch angle and then let the chips fall where they may. The Mets, on the other hand, chose to take a contact-first approach, which means that their softer contact can still lead to more hits. Those of the modern school may call that lucky, but in many ways, putting the ball in play forces the defense to make the play.
You do that often with a specific focus on where and what pitch to hit, and good things generally happen.
2023 Look Ahead
After Lindor’s second season in New York was such a success, look for more of the same hitting approach from the Mets’ shortstop. The 2022 season saw Lindor put up the second-highest fWAR total of his career. Rather than trying to hit the cover off the ball, it’s more likely that Lindor continues to emphasize contact even at the expense of a loss of average exit velocity and launch angle.
ZiPS’s most updated projections expect Lindor to hit .255/.328/.440/.768 in 2023 with 26 homers, 93 RBI, and 6.1 fWAR. Considering that ZiPS uses a model from the last three years, and Lindor went below his career norms in 2021-22, it would not be surprising to see him exceed those benchmarks in 2023 and put up a season more statistically similar to last year’s.
However, 6.1 fWAR is still nothing to sneeze at, and the Mets would take another 26 homers from their de facto infield captain. Mr. Smiles is still in the prime of his career and making New York his own. Expect more reasons to cheer for him this season.


