Since the New York Mets’ last rebuilding phase began at the start of this decade, the focus has been on the starting rotation. And once their competitive window opened in 2015, the team’s eventual failure or success has always been tied to how far this particular part of the roster could carry them.
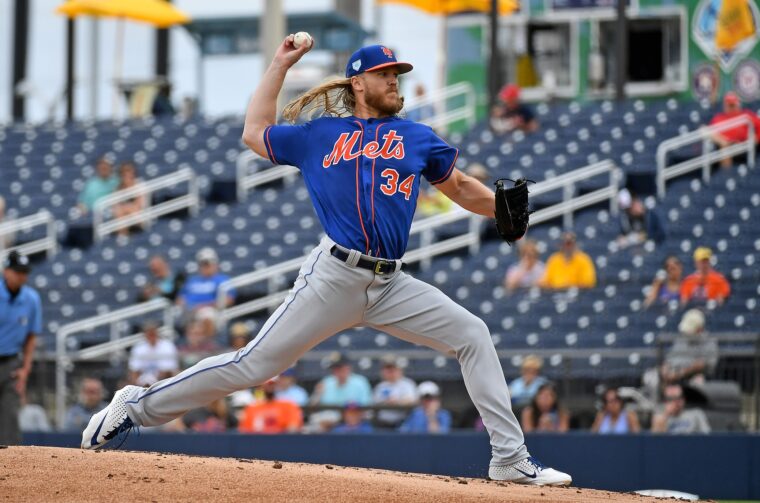
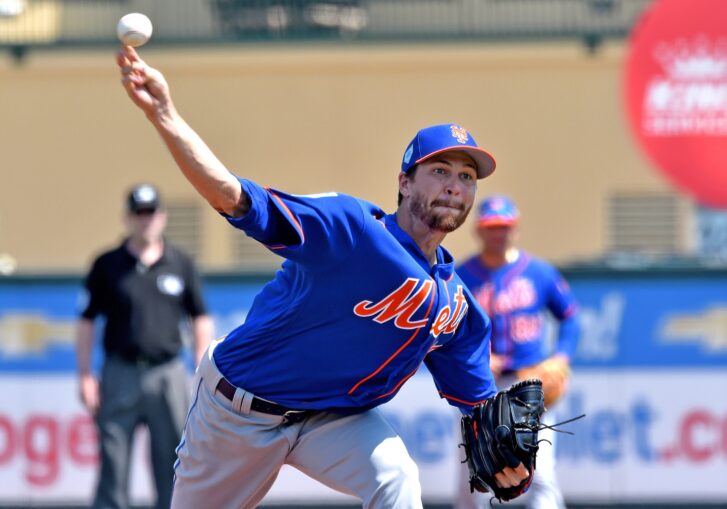
Some years — like in ’15 and ’16 — it worked pretty well. Outside of Jacob deGrom, things fell apart in 2017, and despite a general rebound last year, New York couldn’t recover from the early-season tailspin that happened right after a hot start. As certain hurlers, like deGrom, Noah Syndergaard, and Zack Wheeler, continue inching toward free agency, time is running out to capitalize on the excess value this group can return when looking at their respective salaries.
While spring-training results should always be taken with a grain of salt, the Mets’ projected rotation appears to be ready for games to start counting. Outside of tough results for Steven Matz lately (10.97 ERA in 10.2 innings), every other starter — even Jason Vargas — has looked good on the mound. ERA is the first number that jumps out, but their respective strikeout-to-walk ratios are also encouraging signs as Opening Day continues creeping closer.
How exactly can this group distinguish themselves as a unit in 2019, though? As a way to capture analyze overall production on the mound, I decided to use player fWAR production.
Benchmarks and Parameters
What’s a good fWAR benchmark to have for an exercise like this? Just about any number will feel arbitrary, and this occurrence is no different. Still, there’s a method to the madness (at least a little bit).
After looking through individual season-long performances by starting pitchers in recent years, I settled on 4.0 fWAR as being the minimum qualifier because it consistently captured the top 15-20 hurlers during any given year. They also had to qualify for the ERA title.
The actual exercise itself was going year-by-year to see how many starters on the same team landed in this particular group of elite performances. Technically, the Mets accomplished this last year with deGrom (9.0), Syndergaard (4.2), and Wheeler (4.2) all clearing that arbitrary benchmark, but Thor fell just shy of qualifying for the ERA title with 154.1 innings pitched.
Would it be rare if they all produced more than 4.0 fWAR again this year? What about 5.0 fWAR? What if another starter joins them (like if Matz stays healthy and finally experiences a true breakout)?
Looking Back on This Decade
During this current decade (2010-19), there have been 37 different times when at least two teammates produced at least 4.0 fWAR on the mound in the same season. That doesn’t make this occurrence feel all that special. However, it’s much more rare for at least three teammates to accomplish such a feat.
Of those 37 occurrences, three or more teammates have produced 4.0-plus fWAR in a single season just seven times. The 2018 Cleveland Indians and 2013 Detroit Tigers get bonus points for being the only teams with four teammates landing on the list. Below is a full look at the teams, years, pitchers, and their respective fWARs.
| Season | Name | Team | WAR |
|---|---|---|---|
| 2018 | Trevor Bauer | Indians | 6.3 |
| 2018 | Corey Kluber | Indians | 5.7 |
| 2018 | Carlos Carrasco | Indians | 5.2 |
| 2018 | Mike Clevinger | Indians | 4.5 |
| 2016 | Kyle Hendricks | Cubs | 4.7 |
| 2016 | Jon Lester | Cubs | 4.4 |
| 2016 | Jake Arrieta | Cubs | 4.1 |
| 2013 | Max Scherzer | Tigers | 6.2 |
| 2013 | Anibal Sanchez | Tigers | 6.1 |
| 2013 | Justin Verlander | Tigers | 4.9 |
| 2013 | Doug Fister | Tigers | 4.3 |
| 2011 | Zack Greinke | Brewers | 4.6 |
| 2011 | Yovani Gallardo | Brewers | 4.4 |
| 2011 | Shaun Marcum | Brewers | 4.3 |
| 2011 | Madison Bumgarner | Giants | 5.5 |
| 2011 | Matt Cain | Giants | 5.5 |
| 2011 | Tim Lincecum | Giants | 4.6 |
| 2011 | Roy Halladay | Phillies | 8.0 |
| 2011 | Cliff Lee | Phillies | 6.5 |
| 2011 | Cole Hamels | Phillies | 4.7 |
| 2010 | Clayton Kershaw | Dodgers | 4.9 |
| 2010 | Hiroki Kuroda | Dodgers | 4.4 |
| 2010 | Chad Billingsley | Dodgers | 4.3 |
What’s noticeable is that reaching this particular benchmark was much more common in the National League earlier in the decade, but not so much now. After happening four times from 2010-11, only the 2016 Chicago Cubs have done it in the Senior Circuit.
Although the ’18 Indians and ’13 Tigers have created a separate club within the club, Cleveland makes yet another one by having three starting pitchers produce at least 5.0 fWAR in a single season.
Looking Forward to 2019
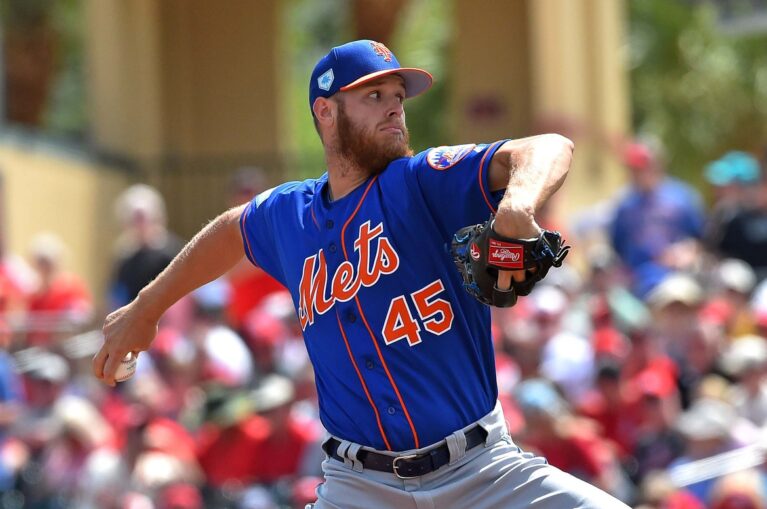
FanGraphs’ depth-chart projections once again has deGrom, Syndergaard, and Wheeler producing the majority of New York’s rotation fWAR. But since Wheeler’s 2018 emergence deviates from the rest of his career to this point, his projection is more conservative.
The potential here is undeniable, though.
In the three seasons in which he’s started at least 30 games, deGrom has never produced less than 4.1 fWAR, and based off his Cy Young-winning campaign, he seems to be a lock for at least 5.0 fWAR if he stays healthy. It’s been a while, but Thor isn’t too far removed from his 5.9 fWAR performance in 2016 (the second-best mark among qualified pitchers). And it wouldn’t be prudent to merely expect Wheeler to duplicate last year’s second-half run, but he did put up 2.5 fWAR over his final 75 innings.
So if things go well, the Mets’ rotation could join an already exclusive group of having three pitchers with at least 4.0 fWAR in a season, and they at least have an outside shot of becoming the first NL team this decade to have three with at least 5.0 in a season.
And, who knows, if Matz does break out in 2019, maybe New York can join the Indians and Tigers in an even more exclusive group. Wherever they end up landing, let’s just hope it brings the kind of results the ’16 Cubs experienced. That’d be cool.


