
The New York Mets have given themselves an outside shot at playoff contention thanks to coming out of the gates strong following the All-Star Game. As a squad, they entered the midsummer respite with a 40-50 record that had them seven games behind the final National League wild-card spot. But a 15-6 stretch (against mostly subpar teams) since coming back from the break has led to a 55-56 overall record and just a three-game deficit in the wild-card chase.
It’s still a stretch that they’ll continue this hot streak and leapfrog all the teams in front of them. However, they’re at least giving themselves a chance, along with providing fans with something fun to watch with the dog days of summer upon us.
As with any hot streak, there are a number of Mets players who have contributed to this production. The following five players have stepped up their respective games in a big way.
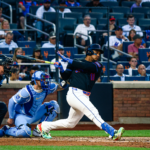
Amed Rosario
First Half: 89 wRC+, 0.6 fWAR in 356 plate appearances
Second Half: 153wRC+, 0.8 fWAR in 86 plate appearances
A couple weeks ago, I touched upon how Amed Rosario‘s offense is continuing to trend upward when looking at this overall statistics. That has continued since he’s remained red-hot over the last month or so. It’s already led to a new single-season career-high mark in home runs (11), a soon-t0-be career high in RBI (47), and a season-long wRC+ that’s currently considered above average (101).
As one can imagine, he’s been doing a little bit of everything right at the plate right now. His walk rate has increased (5.3% to 7.0%), his strikeout rate has drastically decreased (22.2% to 12.8%), his hard-hit rate continues to improve (35.4% to 39.1%), and he’s pulling the ball much more often (28.4% to 42.0%).
When looking at his position, only Xander Bogaerts (171) and Marcus Semien (160) have a higher wRC+ than Rosario since the All-Star break, and he’s among the league leaders when looking at fWAR.
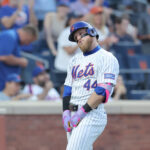
J.D. Davis
First Half: 115 wRC+, 0.7 fWAR in 220 plate appearances
Second Half: 166 wRC+, 0.7 fWAR in 67 plate appearances
J.D. Davis appears to be an expert when it comes to making the most of playing time given to him. He’s truly turned into a valuable asset for the Mets, and he currently appears to be the best (only?) offseason acquisition that has performed well this season.
Through his first 181 career MLB plate appearances (67 games played), Davis had posted a -0.5 fWAR. He had already outperformed that number by a good bit in the first half, but his solid start in the second half continues to further himself from it. Although he continues posting a high ground-ball rate (51.5% this season and above 50.0% in both halves), he’s making the most of whatever contact he is making. Davis’ hard-hit rate has risen from 39.5% to 48.8% when looking at his pre- and post-All-Star break numbers, both of which were a notch above his 35.0% career number heading into 2019.
Noah Syndergaard
First Half: 4.68 ERA, 1.8 fWAR in 105.2 innings
Second Half: 1.78 ERA, 1.6 fWAR in 35.1 innings
Noah Syndergaard‘s first half was a frustrating one when looking at his overall production, but it’s only taken a handful of starts to get himself back on track and dominating like we know he can. One huge aspect behind this rebound has been trusting (and using) his slider again, which I talked about last week in more detail.
This kind of change has had a number of chain reactions to other areas of his profile. First is his strikeout rate — at the All-Star break, Syndergaard’s 22.8% strikeout rate was on pace to decrease for the third straight year. However, his latest surge has resulted in a 27.9% strikeout rate, helping him buck that trend for the time being.
It’s also helped his batted-ball profile, as opposing hitters have produced a 57.6% ground-ball rate, 25.0% fly-ball rate, and a 8.7% infield-fly rate over his last five starts (46.7%, 34.9%, and 11.3%, respectively, in the first half).
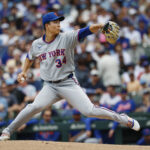
Jacob deGrom
First Half: 3.27 ERA, 3.1 fWAR in 110 innings
Second Half: 0.69 ERA, 1.3 fWAR in 26 innings
For the most part, Jacob deGrom has been his usual dominant self after an uncharacteristically tough March/April. What he’s done thus far through 26 second-half innings, though, is quite literally shades of last year’s Cy Young campaign. He shares some similarities with Thor in the fact that he’s also using his slider much more than he did in the first half, but it’s not as if deGrom wasn’t using it all that often already.
In the first half, deGrom was throwing his slider at a 27.2% clip, which led to a 0.78 value per 100 pitches, according to FanGraphs. Since the All-Star break, the right-hander has used his slider at a 43.7% rate, which has yielded a 2.40 value per 100 pitches, according to FanGraphs. DeGrom’s walk rate has risen more than three percentage points when comparing first-half and second-half numbers. However, his strikeout-to-walk ratio has improved from 25.2% to 26.5% thanks to a five-percentage-point rise in strikeout rate over that same time.
Seth Lugo
First Half: 3.35 ERA, 0.6 fWAR in 43 innings
Second Half: 0.00 ERA, 0.7 fWAR in 10.2 innings
One doesn’t simply win the NL Reliever of the Month award for July and not get mentioned here. Seth Lugo‘s first three months of 2019 were a little bit of a roller coaster with regard to his ERA, but he’s basically been lights out since the start of July.
| Month | Innings Pitched | ERA |
|---|---|---|
| March/April | 17.2 | 4.08 |
| May | 9.1 | 0.96 |
| June | 13 | 4.85 |
| July | 12.2 | 0.0 |
| August | 1.00 | 0.0 |
He’s been so good over the last month that his overall statistics (2.68 ERA, 32.6% strikeout rate, 6.1% walk rate, 1.2 fWAR) are either on par or better than what he accomplished in 2018 (2.66 ERA, 25.1% strikeout rate, 6.8% walk rate, 1.6 fWAR).
Lugo’s curveball usage is up at 24.4% this season, but it’s actually about seven percentage points lower than last year’s total. That difference has mostly gone to his fastball, which he’s thrown 55.8% of the time (48.9% in ’18). Opposing hitters have failed to produce a wRC+ higher than 40 against either pitch since the start of last season, but the big change has come in his curveball strikeout rate. In 2018, he punched out 25.7% of hitters with that offering, a number that’s climbed up to 35.3% so far this year.


