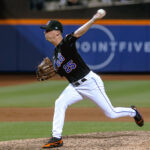
There were red flags pointing to Wheeler’s elbow injury in 2015
A Major League Pitcher is a fragile thing. An unnatural motion is repeated over and over again with great stress until, inevitably the elbow or shoulder wear down and/or break. As every pitcher is different, there is no exact science to determine what the breaking point will be or how much stress the arm can take before it breaks down.
I decided to take a look at MLB starting pitchers over the last 10 seasons to see if there was any correlation between the number of pitches per inning (the amount of stress on the arm before getting a rest between innings – much like a break between reps in a workout) and injury. I went into this little study with no preconceived notions or assumptions and decided I would look at simply the raw data. The benchmark I’m also using is 20 starts in a MLB season (although many of these starters also logged innings in relief and/or the minors in any given year).
Over 2006-2015 seasons, starters with 20+ starts were fairly consistent:
2015 – 124 pitchers
2014 – 130 pitchers
2013 – 128 pitchers
2012 – 125 pitchers
2011 – 132 pitchers
2010 – 126 pitchers
2009 – 117 pitchers
2008 – 128 pitchers
2007 – 122 pitchers
2006 – 115 pitchers
Number of pitches/inning for the median pitcher:
2015 – Jon Niese (Mets) – 15.85
2014 – James Shields (Royals) – 16.00
2013 – Wade Miley (Diamondbacks) – 15.98
2012 – Jake Peavy (White Sox) – 15.92
2011 – John Lannan (Nationals) – 15.91
2010 – Jon Lester (Red Sox) – 16.14
2009 – Chris Volstad (Marlins) – 16.36
2008 – Jamie Moyer (Phillies) – 16.16
2007 – Jeff Suppan (Brewers) – 16.17
2006 – Scott Olsen (Marlins) – 16.14
As illustrated, the Median has also been fairly consistent over the last 5 years.
The upper 10% efficiency:
2015 – 14.78/inning or less
2014 – 14.88/inning or less
2013 – 15.00/inning or less
2012 – 15.03/inning or less
2011 – 15.01/inning or less
2010 – 15.09/inning or less
2009 – 15.25/inning or less
2008 – 14.93/inning or less
2007 – 14.93/inning or less
2006 – 14.96/inning or less
As illustrated above, averaging roughly 15 pitches per inning gets a pitcher into at or near the top 10% in efficiency. That is 105 pitches to get through a full 7 innings and 120 pitches to get through a full 8 innings before yielding to the closer.
The lower 10% efficiency:
2015 – 17.01/inning or more
2014 – 17.12/inning or more
2013 – 17.43/inning or more
2012 – 17.19/inning or more
2011 – 17.13/inning or more
2010 – 17.05/inning or more
2009 – 17.56/inning or more
2008 – 17.48/inning or more
2007 – 17.36/inning or more
2006 – 17.14/inning or more
By the same token, averaging roughly 17 pitches/inning or more will put a pitcher at nearly the lowest 10% in terms of inefficiency. While an additional two pitches per inning may not seem like a lot, does the stress of throwing max effort an extra two times per inning before taking a break on the bench make a difference? Over 7 innings, that would be an extra 14 pitches. That is roughly 102 pitches to get through 6 innings, or approximately cramming a 7 inning start for an efficient pitcher into 6 innings with less rest. Does cramming this work into a shorter period create more stress that ultimately leads to breakdown?
From 2006 to 2015, 70 different pitchers had 127 instances of pitchers averaging 15 pitches per inning or less with 20 starts in the majors.
From 2006 to 2015, there were 200 instances of pitchers averaging 17 pitches per inning or more.
Is there any correlation between extreme efficiency or inefficiency and shoulder/elbow injuries during that season or the following year?
Seven of the 70 pitchers who hit the elite efficiency mark did it for the first time in 2015. Of the 63 pitchers where we can see if they had any shoulder/elbow issues the season after achieving elite efficiency, 14 (22%) became injured:
Chris Carpenter (TJ in 2007 after 1516 career innings – had prior elbow/shoulder issues), Tim Hudson (TJ in 2008 after 2017 career innings), John Smoltz (shoulder in 2008 after 3395 career innings – also prior TJ), Justin Duchscherer (shoulder after 426 career innings), Dallas Braden (shoulder after 491 career innings), Roy Halladay (shoulder in 2012 after 2531 innings through 2011), Jaime Garcia (shoulder ended 2012 after 495 career innings), Josh Tomlin (TJ ended 2012 after 341 career innings), Clayton Richard (shoulder ended 2013 after 773 career innings), Cliff Lee (elbow ended 2014 after 2156 career innings), Bronson Arroyo (TJ ended 2014 after 2364 career innings), Patrick Corbin (missed 2014 with TJ after 315 career innings), Martin Perez (TJ ended 2014 after 213 career innings), Henderson Alvarez (shoulder ended 2015 after 563 career innings), and Masahiro Tanaka – (partially town elbow in 2014 after 1315 innings in Japan through 2013, returned later that year).
Notice a pattern among the injuries among the elite efficiency pitchers? Half of them had racked up significant mileage in excess of 1300 innings before suffering an injury during or after an elite season. Of the 7 pitchers that didn’t have excess mileage, 5 of the injuries were shoulder related. Only two pitchers that didn’t have a ton of mileage on their arms suffered Tommy John after an efficient season.
As there were pitchers who hit the efficiency list more than once, there were 120 instances where we have elite efficiency and we were able to see the impact that same or the following year. A few on the list also logged in a ton of innings over long careers before going down. When looking at the following season effect, we have a shoulder/elbow injury rate the following year dropping to just 12%. The Tommy John rate following an elite efficiency season was just 4%.
If the 12% shoulder/elbow injury rate holds true for the 2016 season, we can expect two injuries among the 14 pitchers who are returning in 2016 and achieved elite efficiency (Bartolo Colon, Jaime Garcia, John Lackey, Mike Leake, Hisashi Iwakuma, Phil Hughes, Zack Greinke, Clayton Kershaw, Max Scherzer, Cory Kluber, Erasmo Ramirez, Matt Harvey, Sonny Gray, and Masahiro Tanaka). Two of the 16 pitchers who achieved the elite mark in 2015 (Tim Hudson and Mark Buehrle) have retired. An injury among any of the above is also much more likely to be shoulder related if historical patters hold true.
In reviewing the inefficient pitchers, there were 127 pitchers who made at least 20 starts. How many ended up with shoulder or elbow issues that were either shut down that very season or missed time the following year? 30 of these pitchers ended up injured, which is a 24% rate of injury. If we were to take this on a per-instance rate, there were 32 injuries after 187 instances from 2006-2014 where we saw the effect the following year, which is a 17% injury rate. We’ve already seen the effect of the inefficient 2015 seasons on Lance Lynn who will miss 2016 with Tommy John, Joe Kelly who was shut down at the end of 2015 with shoulder issues, and Nathan Eovaldi who had 2015 end early with elbow trouble – if we were to include these three injuries, we’d be at 18%.
The difference in injury to the individual pitcher isn’t much (22% vs 24%), but half of the pitchers who were injured following elite efficiency years had significant mileage. We also see an uptick in total injury instance the following year on a per-instance basis (12% vs 17%). Where we do see a huge injury jump is the injury rate among pitchers who have been highly inefficient for two or more seasons. 38% (18 of 47) pitchers who have been highly inefficient in more than 1 season in which they’ve made 20 or more starts have ended up with shoulder/elbow issues the same or following year:
Scott Kazmir (shoulder), John Maine (shoulder), Edinson Volquez (elbow), Gil Meche (shoulder), Doug Davis (elbow), Kyle Davies (shoulder), Daisuke Matsuzaka (elbow), Tom Gorzelanny (elbow), Phil Hughes (shoulder), Danny Duffy (elbow), Chad Billingsley (elbow), Drew Pomeranz (biceps/elbow), Mike Pelfrey (shoulder/elbow), Felix Doubront (shoulder), Matt Moore (elbow), C.J. Wilson (elbow), Nathan Eovaldi (elbow), and Lance Lynn (elbow) all had issues after averaging 17 pitches/inning or greater 2x or more while making 20+ starts.
If a 38% injury rate among pitchers who have been highly inefficient on more than one occasion and were inefficient the previous year holds true, we can expect to see 2 of the 6 pitchers who reached this status go down in 2016. Lance Lynn was one of the six and will miss all of 2016 following had Tommy John. Who else is in the danger zone for 2016?
- Nathan Eovaldi (Yankees) – his 2015 season ended early with elbow trouble (614 career innings).
- Danny Duffy (Royals) – he’s already had Tommy John once (443 career innings).
- Ian Kennedy (Royals) – he just signed for 5 years, $70 million (1234 career innings).
- Yovanni Gallardo (free agent) – can this be a factor in his lack of a signing? (1473 career innings)
- Hector Santiago (Angels) – he also had his innings load jump 27% over 2014 (532 career innings).
Two of the above five have already had elbow issues. Two more are at or near innings levels where even elite efficiency pitchers have broken down. One saw an increased workload at higher stress levels.
So how does our Mets staff look and how have their pitch efficiency been over the last few years?
Matt Harvey:
2015 – 14.78
2013 – 15.12
2012 – 16.48 (in 10 starts)
Jacob deGrom:
2015 – 15.58
2014 – 15.93
Noah Syndergaard:
2015 – 15.87
Steven Matz:
2015 – 16.15
Bartolo Colon:
2015 – 13.90
2014 – 14.88
2013 – 14.59
2012 – 14.05
2011 – 15.47
Zack Wheeler:
2014 – 17.85
2013 – 17.28 (in 17 starts)
Notice something interesting? I was using 20 starts as a barometer, a benchmark that Wheeler did not make in 2013. However, in his 17 starts he was in excess of 17 pitches/inning. Remember the little observation that pitchers who had two or more seasons with a lot of starts and extreme inefficiency had a 38% injury rate right after an inefficient season? Wheeler’s injury risk was a blinking red light. Then again, Harvey was just above that 15 pitch/inning mark when he went down in 2013 (after a season where he was pushing the 16.5 mark in 2012).
I’m not a professional statistician, but I think you’d agree that this is an interesting observation on the outliers when it comes to starting pitching… the most efficient starters get hurt at a much lower rate and they rarely have Tommy John issues the year following an efficient workload (which bodes well for Matt Harvey). Those that are repeatedly inefficient are much more likely to succumb to injury – which would suggest that Wheeler should focus on pounding the strike zone and get quicker outs.


