
We compare Wright against Sandberg, Dawson, and Jones to determine whether David Wright is on track for the Hall of Fame.
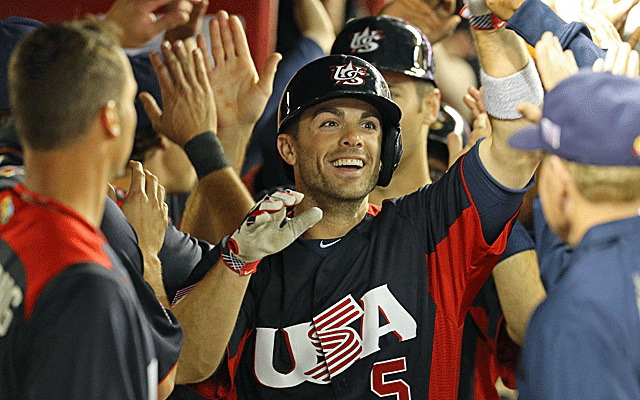
A few days ago, the guys on MLB Now were talking about David Wright‘s chances at the Hall of Fame. He had just recorded his 1,500 hit of his career, and those sorts of milestones tend to bring up this kind of debate.
So is David Wright a future Hall of Famer? Obviously we don’t have the answer to that question yet, but we can certainly use Wright’s career numbers up to this point to see if he is at least on track to Cooperstown.
To do this, I will use three players whose numbers are very similar to Wright’s. The first two are Ryne Sandberg and Andre Dawson, who each got in with just over 75% of the vote. The third is a certain future Hall of Famer: Chipper Jones. Let’s see how they compare.
Offensive Production
Offense has definitely been David Wright’s bread and butter. A consistent .300/.390/.500 hitter, Wright has been one of the top offensive players in the game, and one of best (and at times, the best) third baseman in baseball.
He stacks up very well with Sandberg, Dawson, and Jones through age 30:
Dawson: 1313 G, .279/.324/.476, 205 HR, 760 RBI, 235 SB
Sandberg: 1389 G, .287/.342/.452, 179 HR, 649 RBI, 275 SB
Jones: 1252 G, .309/.404/.544, 253 HR, 837 RBI, 114 SB
Wright: 1334 G, .301/.382/.507, 216 HR, 859 RBI, 178 SB
As you can see, Wright stacks up just as well with Dawson, Sandberg, and Jones in a few catagories, and has significantly better slash lines than Dawson and Sandberg. Jones is considered a much better player than Wright, but Wright’s numbers still stack up well against him.
Clutchness
One can’t evaluate offensive performance without evaluating how a player performs in the high leverage situations. The issue here is the fact that Wright, Sandberg, and Dawson each have very little postseason experience, while Jones has almost 100 games in October under his belt. Here is how they compare on this front:
Dawson: 15 G, .186/.238/.237, 0 HR, 3 RBI, 2 SB
Sandberg: 10 G, .385/.457/.641, 1 HR, 6 RBI, 3 SB
Jones: 93 G, .287/.409/.456, 13 HR, 47 RBI, 8 SB
Wright: 10 G, .216/.310/.378, 1 HR, 6 RBI, 0 SB
With only these small sample sizes, you can’t really judge (with the exception of Jones), how “clutch” a player is. Dawson, Sandberg, and Wright frankly haven’t been on good enough teams to even be put in those high leverage postseason situations, while Jones has the luxury of making the playoffs on 12 different occasions. Now we have to dig into regular season stats to find an answer. To do this, I look at batting lines in “high leverage” situations, moments in the game that have a big influence on the outcome of the game.
Dawson: 2428 PA, .278/.331/.456
Sandberg: 1792 PA, .290/.352/.462
Jones: 2085 PA, .304/.406/.513
Wright: 1227 PA, .316/.389/.518
Now looking at batting lines in clutch situations is great, but it’s also important to put them in context with a player’s normal production. For that, you look at tOPS+, which is OPS+ specifically for that player’s production. So instead of 100 being league average, it’s a player’s normal production, with each digit higher or lower representing one percent better or worse than normal. Out of the four players we’re looking at, Sandberg and Wright are tied for the highest tOPS+ with 104, meaning they are four percent better than usual in high leverage situations. Dawson has a 97 tOPS+ and Jones has a tOPS+ of 98 in those situations. It’s safe to say Wright comes up big in tense situations pretty often, or at least more often than some of his comparables.
Run Environment
Just as with clutchness, you need to consider run environment when evaluating a player’s production to really put it into context. For this, the easiest metric to use is park factors. Wrigley Field, the home of Sandberg his entire career, has historically been one of the easiest park’s to hit and score in. With its smaller dimensions, it’s one of the best parks for home run hitters. Dawson played the first half in a very neutral stadium in Montreal. Turner Field, where Chipper Jones played his home games, slightly favors hitters as well. Meanwhile, Shea Stadium has historically been a very pitcher-friendly ballpark, with park factors for home runs and hits in the bottom third of the league most years. Citi Field has been even friendlier to pitchers.
Simply using OPS+ takes the park factors out, meaning the advantages and disadvantages of certain ballparks are removed. Here are their OPS+ marks through age 30:
Dawson: 122 OPS+
Sandberg: 115 OPS+
Jones: 143 OPS+
Wright: 136 OPS+
Defense
Defense is always the toughest aspect to evaluate. The stats aren’t as advanced as they are for hitting and pitching, and judging defense with the naked eye often produces shaky results. Nonetheless, it’s clear that this is David Wright’s weakest point. He has had a very up-and-down career at third, and both the stats and the eye can tell you that. Jones is very similar to Wright on defense, and is wildly inconsistent. Dawson and Sandberg have the edge here, as they were both dazzling defenders with fantastic range. Here is how they stack up in both the traditional metrics (fielding percentage) and modern metrics (Range Factor/9 innings):
Fielding Percentage:
Dawson (OF): .983
Sandberg (2B): .989
Jones (3B): .954
Wright (3B): .954
Range Factor per 9 innings
Dawson: 2.39
Sandberg: 5.31
Jones: 2.42
Wright: 2.65
Positional/Era Comparison
Every era is different, and every position is different as well. At the corner infield and outfield positions, there tend to be more productive offensive players. During different time periods, the league may be low on power-hitting third baseman, for example, so putting a player’s production in context with their era and their position in that era is important. For this, we’ll have to go through each player one-by-one.
Andre Dawson

Ryne Sandberg

Chipper Jones

David Wright

While Dawson and Sandberg were among the best at their position, both Wright and Jones were among the best in all of baseball.
Verdict
It is hard for people to compare players like Wright to Hall of Famers because their careers aren’t over yet. At first glance, you may think that Wright is nowhere near any of these players, and you’d be right. That’s completely unfair to Wright, however, because he is only 30 years old. We have the luxury of being ably to look back at the second half of Dawson’s, Sandberg’s, and Jones’s careers and see all the great things they did past 30, while we can’t see that with Wright. When you get past that, however, you begin to see that Wright is unquestionably on the path to Cooperstown.


