I don’t have to rattle off many stats to show that the Mets didn’t have a good offense in 2018. The team scored 676 runs, and the league average was 721 runs scored. The more runs you score, the more wins you should have—hence, the Red Sox led the league in runs scored (876) and they also won the World Series. It may not work out as perfectly as it did in 2018 when the league leader in runs wins the World Series, but the concept is simple enough.
In their defense, the Mets did have some injuries that led to the lackluster offensive output last season. But that doesn’t mean that there weren’t some promising signs for the future in 2018, as has been pointed out by many fans ever since the season ended.
Some of those include:
• Brandon Nimmo established himself.
• Jeff McNeil provided hope.
• Michael Conforto surged in the second half.
• Amed Rosario continued to improve.
I’ve seen many stats used to support the bullet points listed above, and they are something to be excited about. While I do look at many of the stats that are utilized to back up that excitement (like wOBA, wRC+, OPS, Contact% etc.), some don’t take things like bad luck, defensive positioning, or even quality of contact into consideration. I try to solve for those things when analyzing player performance.
The two players I want to focus in this piece are Nimmo and McNeil, mainly because they had breakout seasons in 2018. Let’s attempt to answer the question if their season was really as good as we all thought?
We know that one player can have a higher contact percentage than another player, but does it really matter if the person with a higher contact percentage is hitting weak ground balls (or even just foul balls)? On the other hand, a player can tear the cover off the ball, but he can’t control a Center Fielder robbing him of a home run—in other words, he could have hit a ball just as hard or far as another player that it landed for a home run for (creating a completely different outcome). In either of those situations described above, the descriptive stats may not paint a complete picture of what’s happening.
I generally look at two stats to go along with my two eyes to determine a hitter’s skill: O-Swing% and Expected Stats (like Expected Weighted On Base Average (xwOBA)). You may have heard of O-Swing% before—the percentage of pitches outside of the strike zone that a player swings at, but Expected Stats are a relatively new type of stat developed by MLB Statcast. If you’ve never heard of it and are getting tired of hearing about new stats already, I get it, I really do. But trust me, I only talk about the really cool and helpful stats (like Goose Eggs).
xwOBA basically takes wOBA a step further to try and determine the skill shown at the point of contact by the hitter. What the heck does that mean? Well, the way I use it is to determine if one player’s offensive stats were better than another player’s due to “luck” or maybe some other factor. xwOBA applies weights based on launch angle and exit velocity (quality of contact), then based on historical data on whether similar contact led to hits (hit probability), it spits out the Expected OBA (or what should have happened in that situation based on history). Here is the exact definition from Statcast:
“Expected Outcome stats help to remove defense and ballpark from the equation to express the skill shown at the moment of batted ball contact. By looking at the exit velocity and launch angle of each batted ball, a Hit Probability is assigned based on the outcomes of comparable historic balls in play. By accumulating the expected outcomes of each batted ball with actual strikeouts, walks and hit by pitches, Expected Batting Average (xBA), Expected Slugging (xSLG), and (most importantly) Expected Weighted On-Base Average (xwOBA) tell the story of a player’s season based on quality of and amount of contact, not outcomes.”
The reason I use O-Swing% is that it is the one plate discipline stat that correlates closest to runs produced by a hitter. A lot of the plate discipline stats have to be taken with a grain of salt, but I think everyone will agree that good plate discipline is necessary in order to become a good major league hitter. By looking at the Expected Stats and the O-Swing%, I get a really good idea of a player’s offensive skill set. Let’s take a look at the Expected Stats chart for the 2018 Mets taken from the Statcast website:
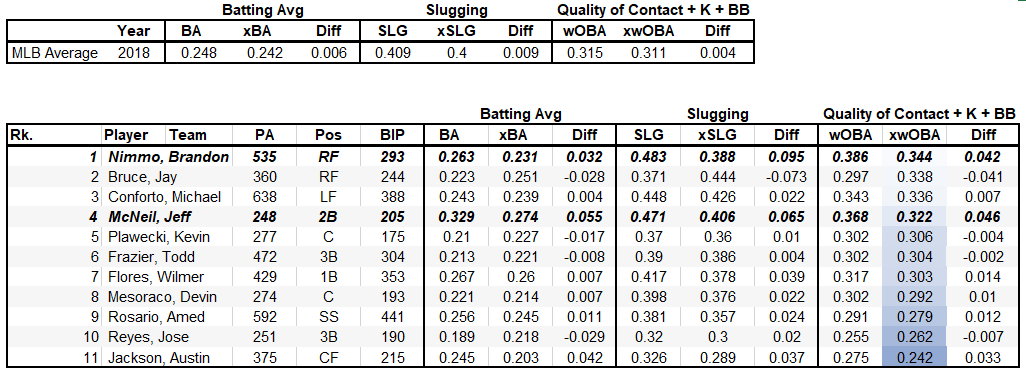
Chart Data From MLB Statcast.
There are two players that jump out to me on that list and they happen to be Nimmo and McNeil. As you can see, their expected performance based on the quality of contact they made last season is much lower than their actual recorded stats.
Expected Batting Average, Expected Slugging and Expected OBA were all significantly down compared to actual Average, Slugging and OBA. Not only that, but the variances are way off compared to the league averages (in each stat), which all fall under .01 difference between actual and expected. That means that the skeptics about these to players performances from 2018 may have a leg to stand on after all.
Nimmo and McNeil seem to have been extremely fortunate in 2018. To put it into perspective, Conforto led the Mets in 2017 with wxOBA, but the variances for all of his stats were right around the league average—the same goes for Yoenis Cespedes who led the team in 2016. This means that the contact they were making historically produced similar results as their actual results—the quality of contact that Nimmo and McNeil made in 2018, did not do this.
What caused such a variance?
Nimmo and McNeil both had excellent BABIP, .351 and .359 respectively. This, in turn, drove their actual batting averages up. But when you consider the quality of contact, their xBA was much lower. Their speed was the first thing I looked at as what could have played a factor in the inflated batting averages. One of the things that the Expected Stats can’t measure for is player speed—so an infield hit for a fast player would historically be considered an out for most players, and then lower their Expected Stats. This may be the case for McNeil, because he legged out a total of 9 infield hits (bunts included), in limited plate appearances. But Nimmo only had 10 infield hits (bunts included), and that wasn’t enough to make that much of a variance in his Expected Stats based on his mount of plate appearances.
In McNeil’s case, it could have been a combination of infield hits and some bleeders that caused his BABIP to increase and drive up those Expected Stats. The other thing that Expected Stats can’t measure for is defensive positioning. It seems like the variances, in both of their cases, could have been caused by opposing defenses being situated in a way that caused a few more balls to drop in for hits that normally would be caught—a.k.a good old-fashioned “luck.” And there ain’t nothing wrong with that, it’s just not sustainable.
Now take a look at the xSLG. Both of them had a lower xSLG than actual SLG, but the player of concern here is Nimmo. Based on his quality of contact last year, his expected slugging should have been nearly 100 points lower than his actual slugging. This immediately has me questioning whether we can expect the kind of power from Nimmo that we saw in 2018 (17 homers), in the future.
In all likelihood, based on historical launch angles and exit velocity, some of those home runs should not have been. Maybe a couple of those dingers got a little boost from the wind, but historically, the ball would have landed in the park for double or maybe even an out (either one would lower xSLG). Speed isn’t normally linked to slugging, but in both Mcneil and Nimmo’s situations, legging out triples that would have historically been doubles (and possibly even outs), could attest to the drop off in xSLG versus SLG as well.
I was really hoping that there would be an explanation that led to the Expected Stats confirming that to Nimmo and McNeil would be able to replicate the type of season they both had in 2018, but there was nothing concrete to support it. It should be noted, however, that although there was fairly wide variance from expected to actual stats, their wxOBAs were both still better than the league averages.
As I stated earlier, the other stat I like to look at when evaluating a player’s offensive skill is their O-Swing%. Here is a breakdown on how the 2018 Mets faired in this category:
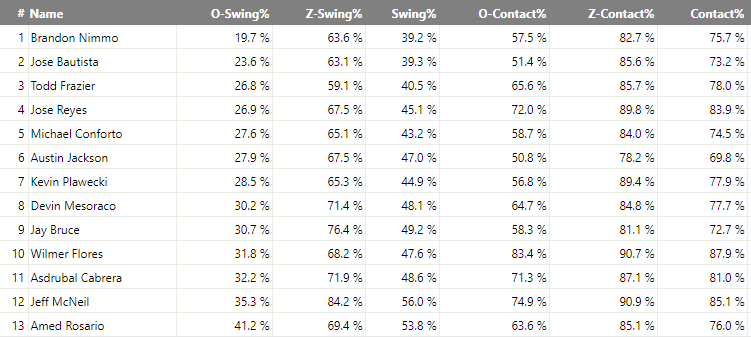
Fangraphs
Nimmo was fantastic in 2018 with O-Swing%–not only did he lead the Mets, but he was also ranked third in the entire MLB last year. Nimmo has developed a skill that generally translates into a player being able to hit well at the major league level. Batting Runs produced also has a higher correlation with a good O-Swing%. McNeil, on the other hand, has some work to do. Based on 200 plate appearances for the Mets last season, only Rosario swung at more pitches out of the strike zone. He makes a ton of contact on balls in the strike zone, but as we discussed earlier, the quality of that contact wasn’t relative to what his BABIP indicated (higher BABIP is generally caused by hard contact).
Needless to say, there are questions as to whether Nimmo or McNeil can repeat their performance in 2018. After deeper analysis, I am slightly more confident that Nimmo will be able to repeat his 2018 performance (because of O-Swing and his ability to barrel up more balls and get that quality contact). Despite Mcneil’s promising contact numbers, the quality of that contact and his discipline at the plate give us a better understanding of why the Mets did not just hand him a starting role headed into 2019.


