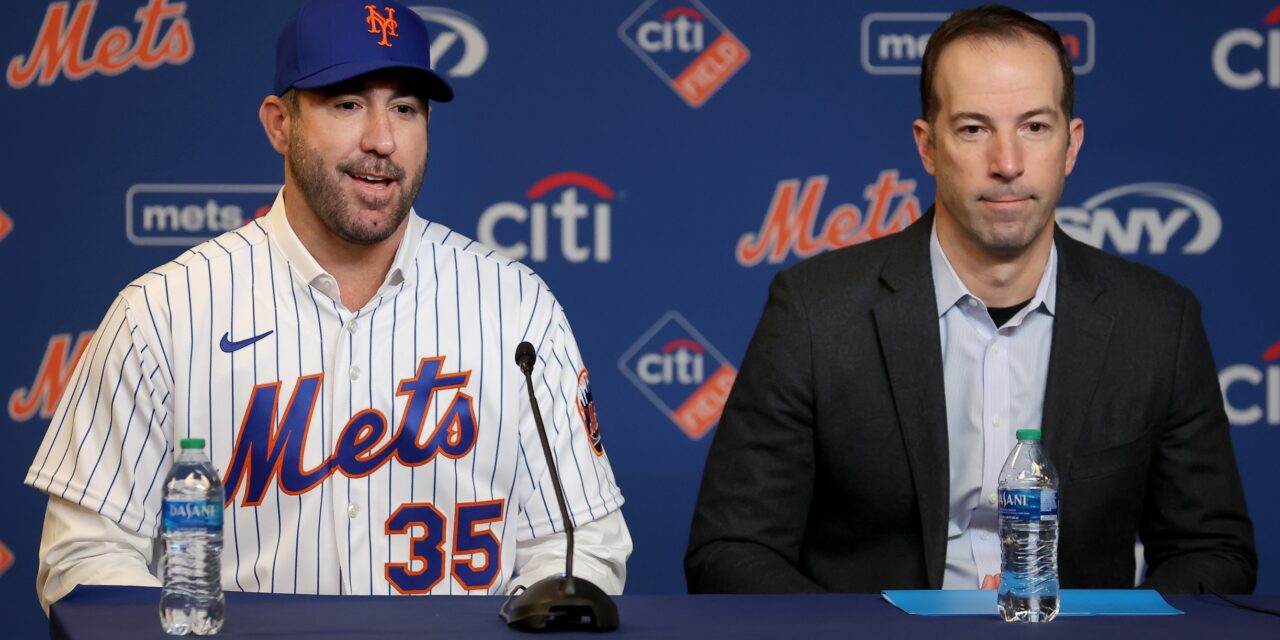
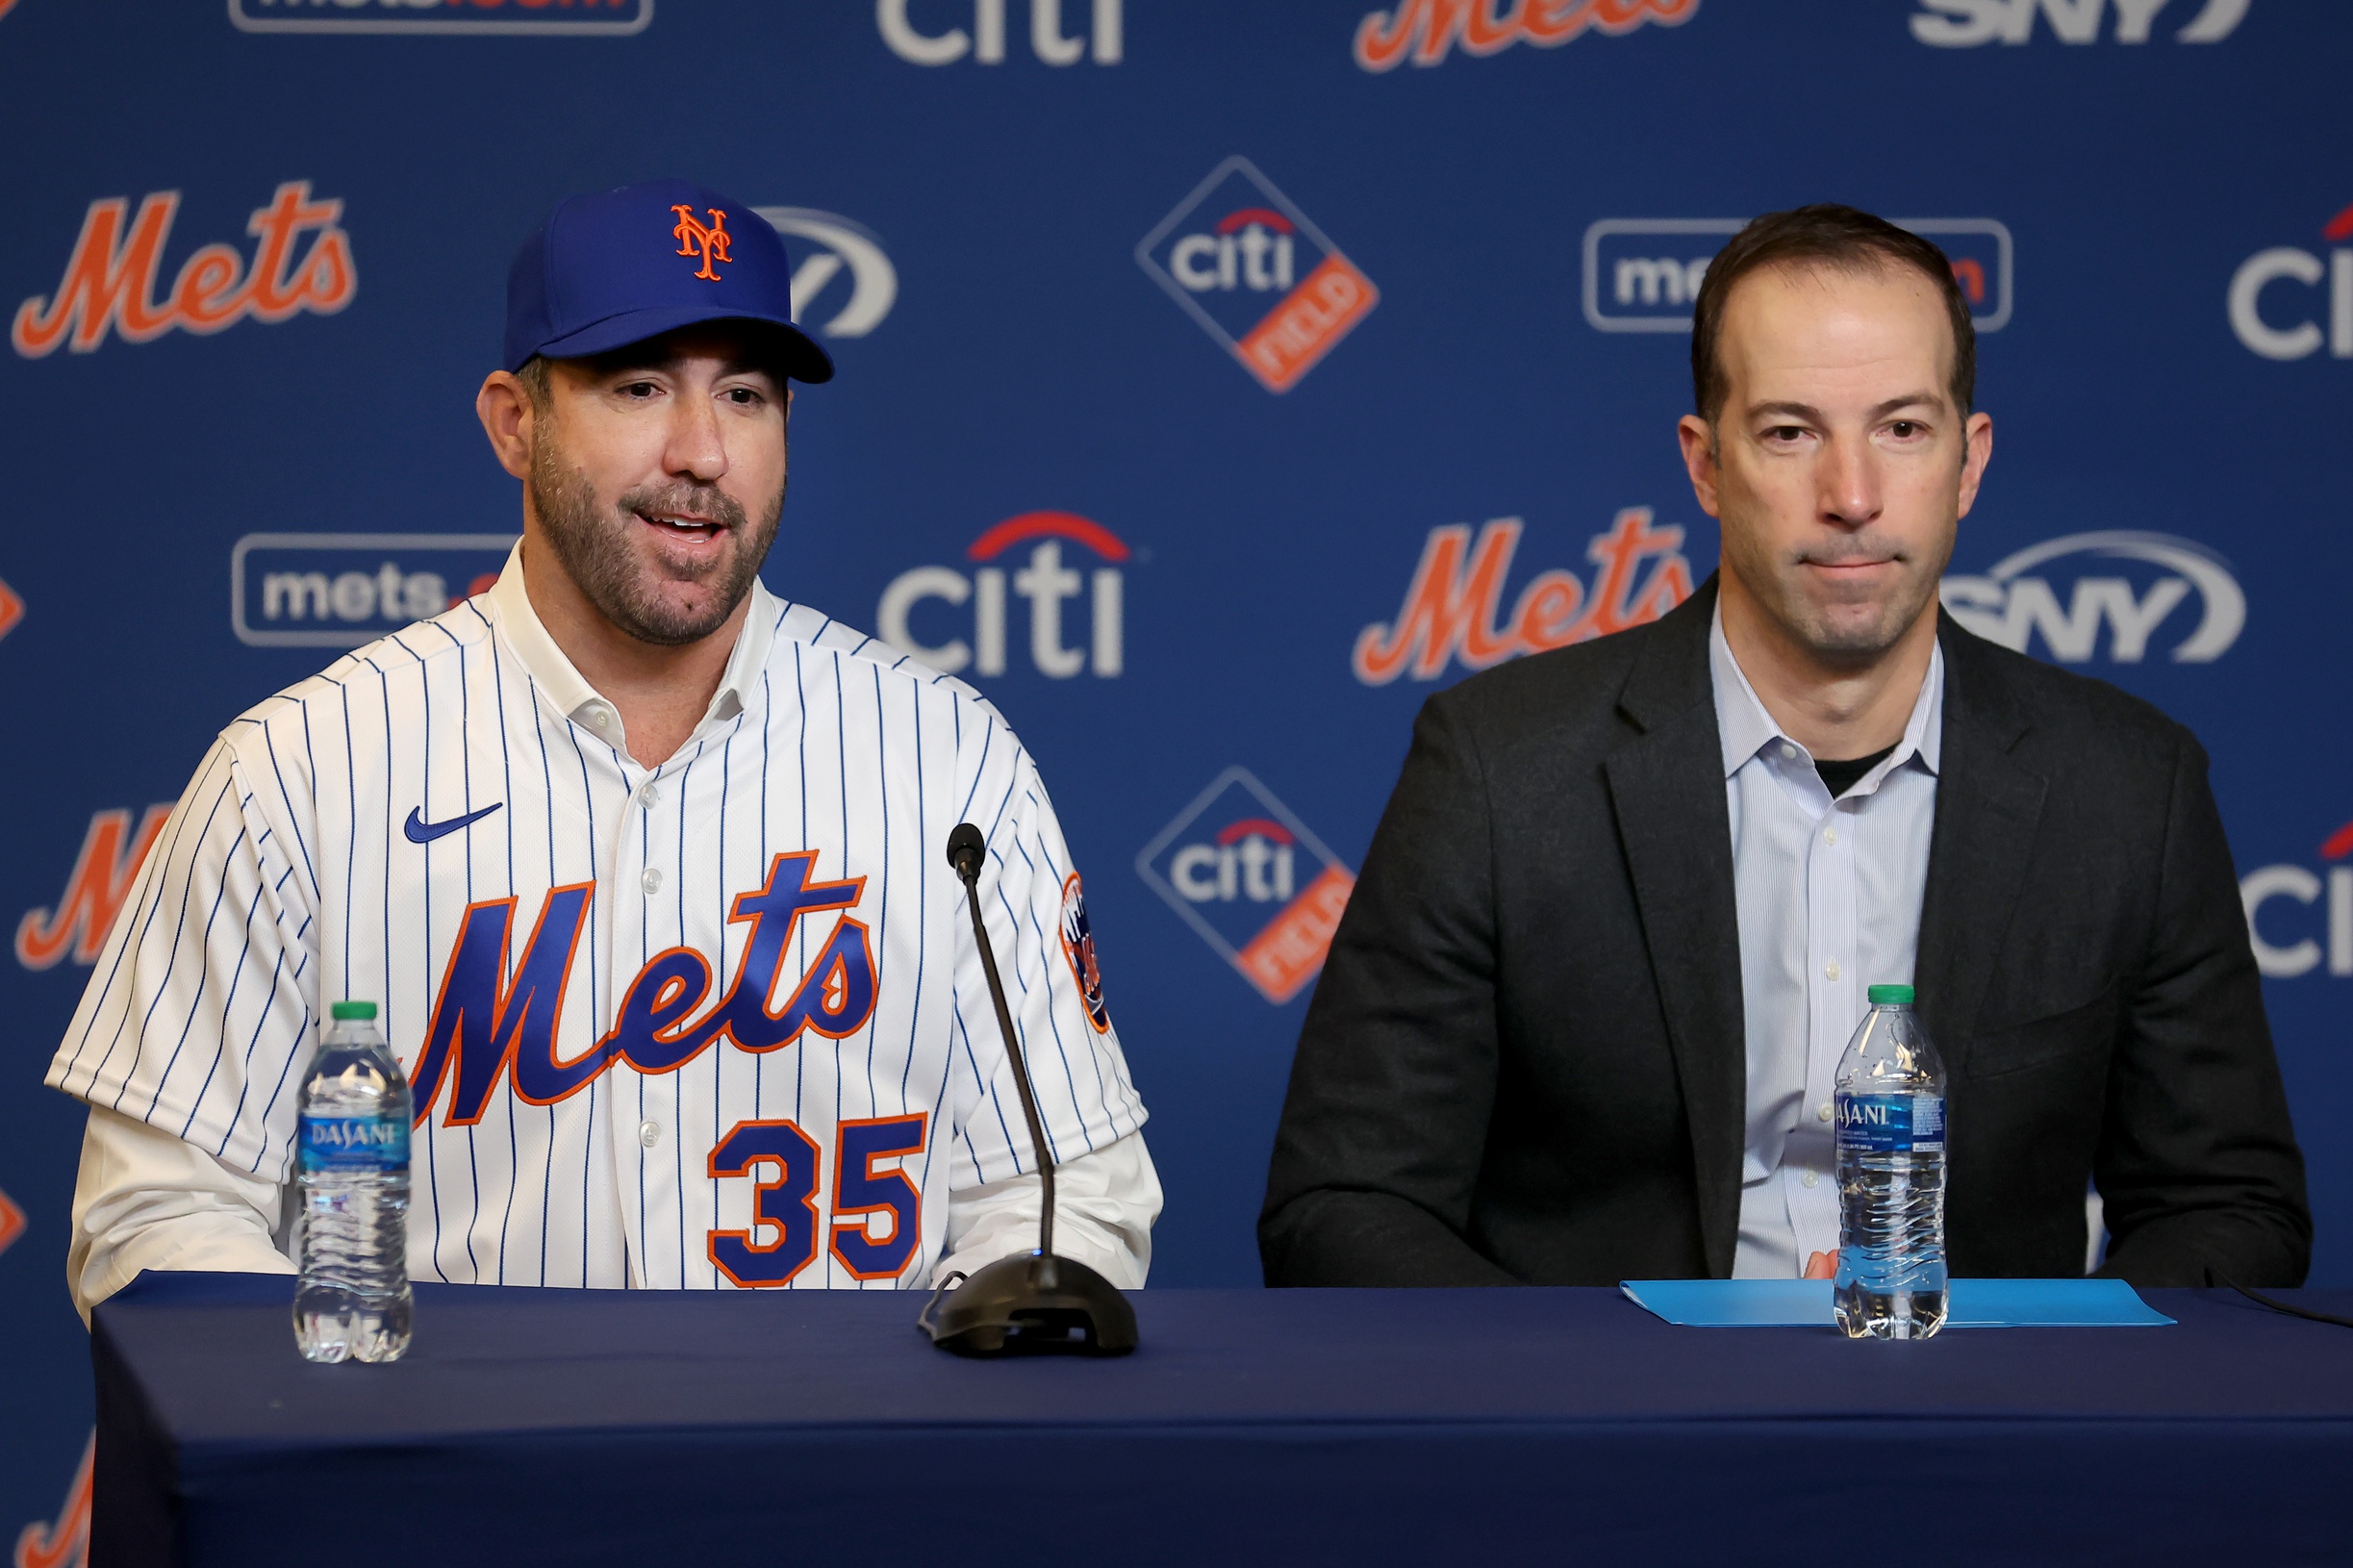
Billy Eppler and Justin Verlander. Brad Penner-USA TODAY Sports
The National League East was one of the best divisions in baseball last season. The division saw three teams move on to the playoffs, it housed two 101-win team, and supplied the National League’s representative in the World Series. Once again, it’s projected to be one of the most competitive divisions in the league. The New York Mets and Atlanta Braves each have top-five odds to win the World Series, and the pennant-winning Philadelphia Phillies are not far behind.
Given the above, it is no surprise that several of the NL East teams were active this off-season. How active you may wonder? Let’s take a look at each team’s additions and subtractions.
Parameters
Next to each player’s name under the ‘subtractions’ section is last year’s WAR generated by the player. This year’s projected WAR for the player will be listed next to their name in the ‘additions’ section. The net WAR added/subtracted will be disclosed at the bottom of each section.
All WAR projections and figures from last year are per Fangraphs.
Not all subtractions and additions are included. The only subtractions are the ones that played a valuable role, for better or worse, with the club last year. As for the additions, only players listed on the Fangraph’s 2023 projected depth charts for the specific clubs are listed.
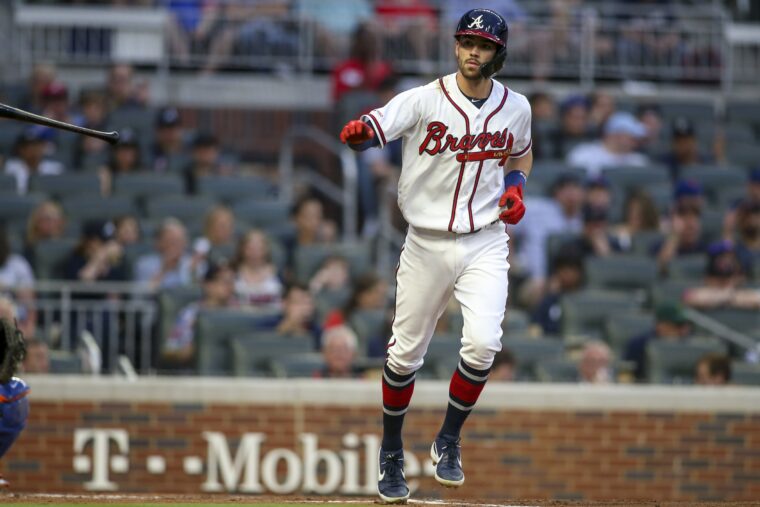
Dansby Swanson. Photo credits: USA Today
Atlanta Braves
Additions:
- Sean Murphy, C (trade): 4.0 WAR
- Joe Jimenez, RP (trade): 0.6 WAR
- Jordan Luplow, OF/1B (free agent): 0.6 WAR
- Lucas Luetge, RP (trade): 0.2 WAR
- Sam Hilliard, OF (trade): 0.1 WAR
- Nick Anderson, RP (free agent): 0.0 WAR
- Dennis Santana, RP (trade): 0.0 WAR
Total Projected WAR Added (per Fangraphs): 5.5 WAR
Subtractions:
- Dansby Swanson, SS: 6.4 WAR
- William Contreras, DH/C: 2.4 WAR
- Kenley Jansen, RP: 1.1 WAR
- Adam Duvall, OF: 0.9 WAR
- Jesse Chavez, RP: 0.9 WAR
- Robbie Grossman, OF: 0.2 WAR
- Jake Odorizzi, SP: 0.1 WAR
- Ehire Adrianza, OF: 0.1 WAR
- Guillermo Heredia, OF: 0.0 WAR
- Darren O’Day, RP: 0.0 WAR
Total WAR Subtracted (per Fangraphs): 12.1 WAR
Net WAR Added/Subtracted: -6.6 WAR

Kodai Senga. Brad Penner-USA TODAY Sports
New York Mets
Additions:
- Justin Verlander, RP (free agent): 4.0 WAR
- Kodai Senga, SP (free agent): 2.2 WAR
- Omar Narváez, C (free agent): 2.0 WAR
- Jose Quintana, SP (free agent): 1.9 WAR
- Tommy Pham, OF (free agent): 0.5 WAR
- David Robertson, RP (free agent): 0.4 WAR
- Brooks Raley, RP (trade): 0.2 WAR
- Elieser Hernández, RP (trade): 0.2 WAR
Total Projected WAR Added (per Fangraphs): 11.4 WAR
Subtraction
- Chris Bassitt, SP: 2.7 WAR
- Taijuan Walker, SP: 2.5 WAR
- Jacob deGrom, SP: 2.2 WAR
- Trevor Williams, SP/RP: 0.6 WAR
- James McCann, C: 0.4 WAR
- Joely Rodriguez, RP: 0.4 WAR
- Seth Lugo, RP: 0.2 WAR
- Trevor May, RP: 0.1 WAR
- Mychal Givens, RP: -0.1 WAR
- Dominic Smith, 1B/DH: -0.1 WAR
- Tyler Naquin, OF: -0.1 WAR
Total WAR Subtracted (per Fangraphs): 8.8 WAR
Net WAR Added/Subtracted: 2.6 WAR
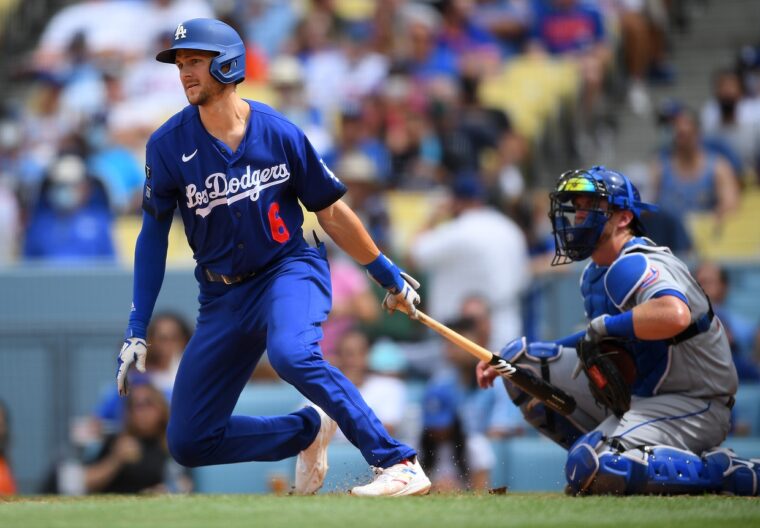
Trea Turner. Mandatory Credit: Jayne Kamin-Oncea-USA TODAY Sports
Philadelphia Phillies
Additions:
- Trea Turner, SS (free agent): 4.5 WAR
- Taijuan Walker, SP (free agent): 1.5 WAR
- Craig Kimbrell, RP (free agent): 0.5 WAR
- Gregory Soto, RP (trade): 0.5 WAR
- Kody Clemens, INF/OF (trade): 0.2 WAR
- Matt Strahm, RP (free agent): 0.1 WAR
Total Projected WAR Added (per Fangraphs): 7.3 WAR
Subtractions
- Kyle Gibson, SP: 1.8 WAR
- Jean Segura, 2B: 1.7 WAR
- Zach Eflin, SP/RP: 1.4 WAR
- Noah Syndergaard, SP: 1.1 WAR
- Nick Maton, INF: 0.8 WAR
- Odúbel Herrera, OF: 0.4 WAR
- Johan Camargo, INF: 0.4 WAR
- David Robertson, RP: 0.3 WAR
- Brad Hand, RP: 0.3 WAR
- Corey Knebel, RP: 0.0 WAR
- Matt Vierling, OF: 0.0 WAR
Total WAR Subtracted (per Fangraphs): 8.2 WAR
Net WAR Added/Subtracted: -0.9 WAR
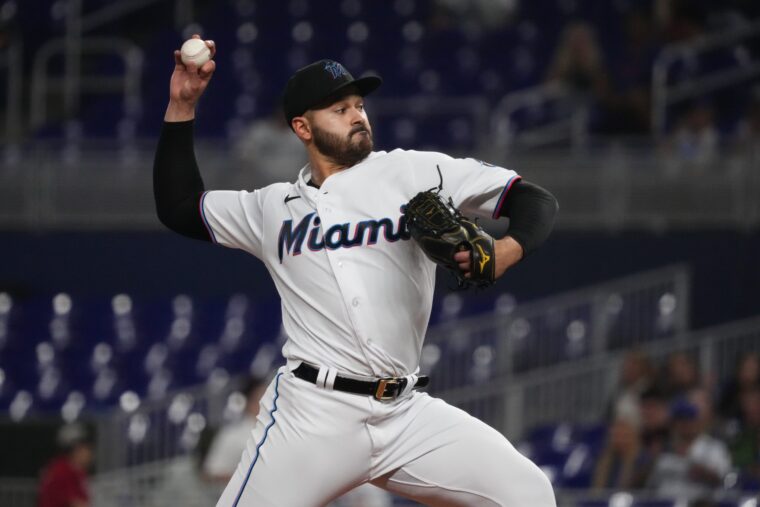
Pablo Lopez. Jasen Vinlove-USA TODAY Sports
Miami Marlins
Additions:
- Luis Arráez, INF (trade): 3.3 WAR
- Jean Segura, 2B (free agent): 2.4 WAR
- Johnny Cueto, SP (free agent): 0.9 WAR
- JT Chargois, RP (trade): 0.1 WAR
Total Projected WAR Added (per Fangraphs): 6.7 WAR
Subtractions
- Pablo López, SP: 2.8 WAR
- Miguel Rojas, SS: 1.2 WAR
- Brian Anderson, 3B/OF: 0.5 WAR
- Jeff Brigham, RP: 0.2 WAR
- Cody Poteet, RP: -0.1 WAR
- Cole Sulser, RP: -0.2 WAR
- Lewin Diaz, 1B: -0.7 WAR
- Elieser Hernández, RP: -0.9 WAR
Total WAR Subtracted (per Fangraphs): 2.8 WAR
Net WAR Added/Subtracted: 3.9 WAR
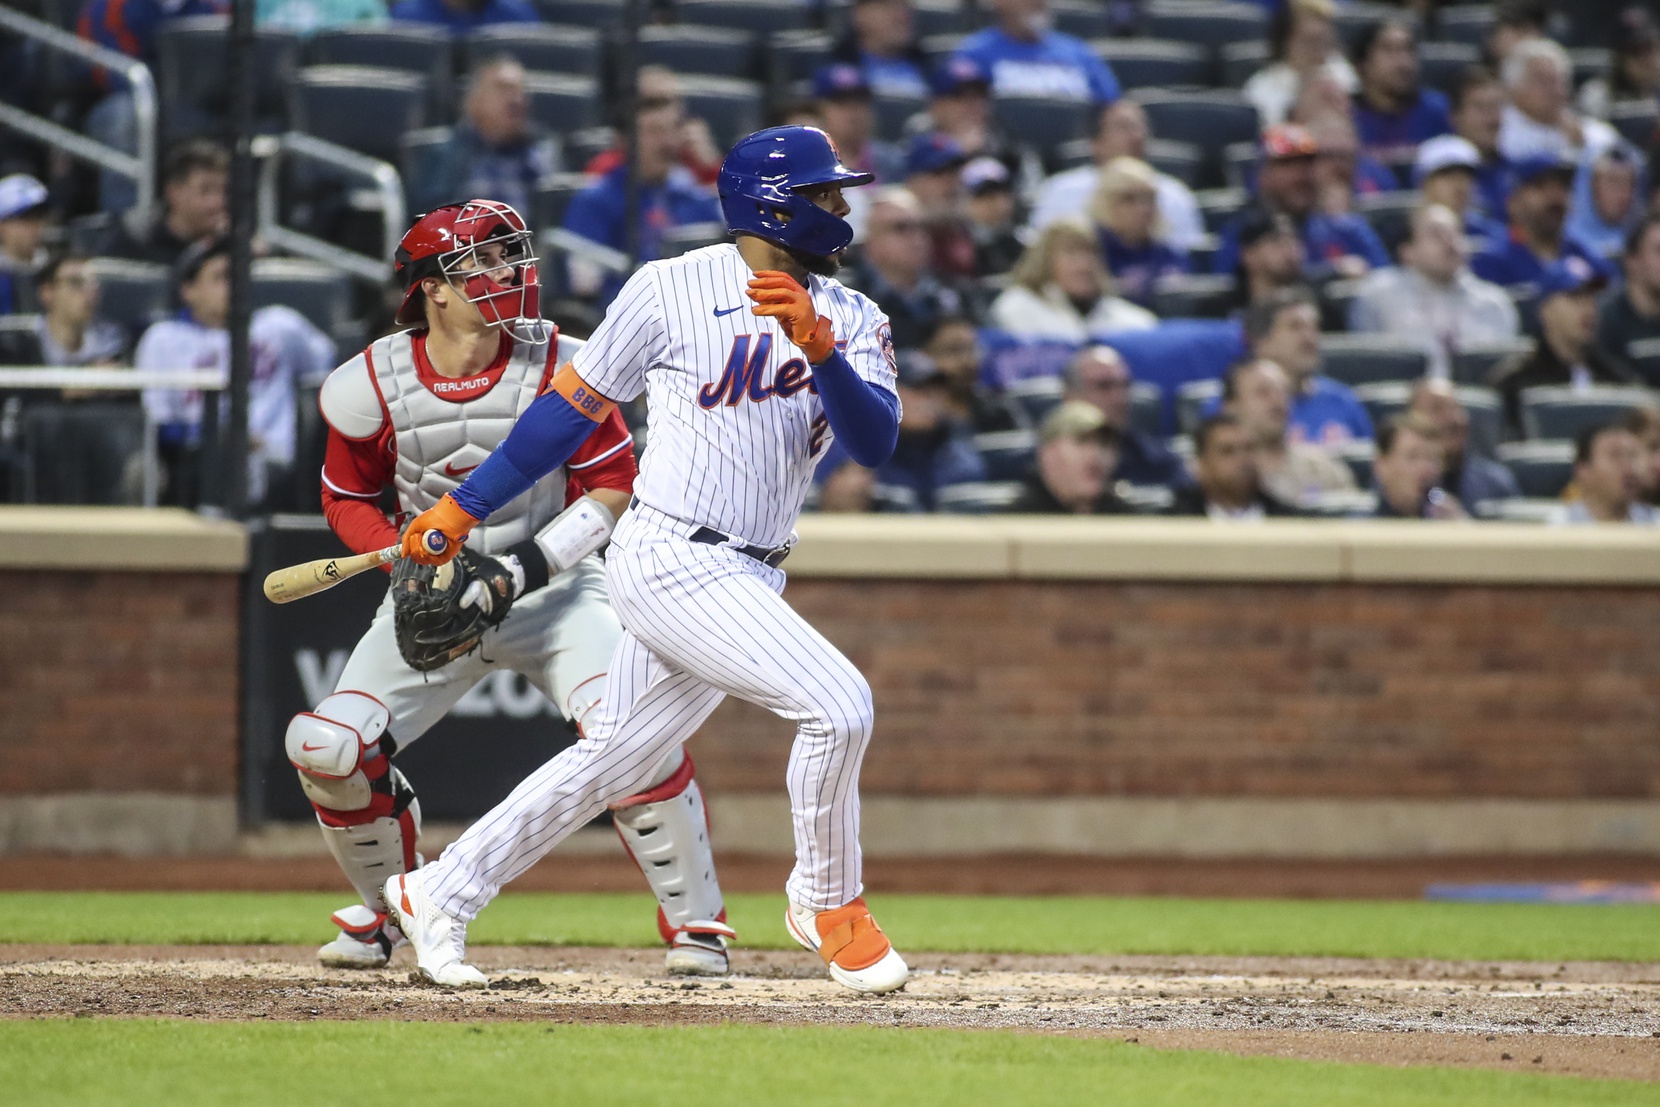
Dominic Smith. Wendell Cruz-USA TODAY Sports
Washington Nationals
Additions:
- Jeimer Candelario, 3B/1B (free agent): 1.6 WAR
- Dominic Smith, 1B (free agent): 1.1 WAR
- Trevor Williams, SP (free agent): 0.9 WAR
- Corey Dickerson, OF (free agent): 0.6 WAR
- Stone Garrett, OF (free agent): 0.4 WAR
Total Projected WAR Added (per Fangraphs): 4.6 WAR
Subtractions:
- César Hernández, 2B/OF: 0.5 WAR
- Erick Fedde, SP: 0.4 WAR
- Anibal Sánchez, SP: -0.2 WAR
- Luke Voit, 1B: -0.3 WAR
- Steve Cishek, RP: -0.3 WAR
- Nelson Cruz, DH: -0.8 WAR
Total WAR Subtracted (per Fangraphs): -0.7
Net WAR Added/Subtracted: 5.3 WAR
Summary
- Nationals: +5.3 WAR
- Marlins: +3.9 WAR
- Mets: +2.6 WAR
- Phillies: -0.9 WAR
- Braves: -6.6 WAR
Final Thoughts
As you can see, it was a busy off-season for several teams in the NL East. The division added some new stars in the likes of Trea Turner, Justin Verlander, Sean Murphy, and Luis Arráez. The division also saw the departure of some familiar faces in Jacob deGrom, Dansby Swanson, Miguel Rojas, Pablo López, and Zach Eflin. Regardless, expect the competition to be at an all-time high.
Loose projections have the lowly Nationals being the ‘most improved,’ with the Marlins right behind them. It appears Fangraphs also likes what the Mets did this off-season, showing a net improvement.
As for the Braves, despite adding Sean Murphy, overall, they did not add a lot and lost the likes of Dansby Swanson, William Contreras, and Kenley Jansen all depart. Thus, a potential for some regression this upcoming season. Lastly, despite adding superstar Trea Turner, the Phillies lost a decent number of depth producers (Segura, Eflin, Maton, Syndergaard, etc.) resulting in a lackluster overall value being added.
Despite all this, projections are only that. Only time will tell how all these off-season moves pay off for the each team. Certainly an exciting season in the making, nonetheless.


