The secret has been out of the bag for years: while the New York Mets need some semblance of an offense to have success, this team will ultimately go as far as their pitching staff — and more specifically, the starting rotation — will carry them.
That’s why it was so troubling to see the rotation completely break down in 2017 after a couple of strong performances as a unit. Their 5.14 rotation ERA was the fourth-worst in baseball, which was also accompanied by a troubling home-run rate (1.39 homers allowed per nine innings) and walk rate (3.37 walks per nine). Oh yea, and the only one that seemed to be reliable was Jacob deGrom, which is no surprise at this point.
What happened in 2017 is likely a big reason why the Mets ended up picking Mickey Callaway as their new manager, as well as bringing in Dave Eiland as the pitching coach. The overall results led to a second straight losing campaign, but the rotation bounced back in a rather significant way.
Plenty of work needs to be done to this roster in advance of 2019, but as it’s currently constructed, the Mets’ rotation doesn’t look too shabby. According to Roster Resource, here’s what their starting five could look like in March:
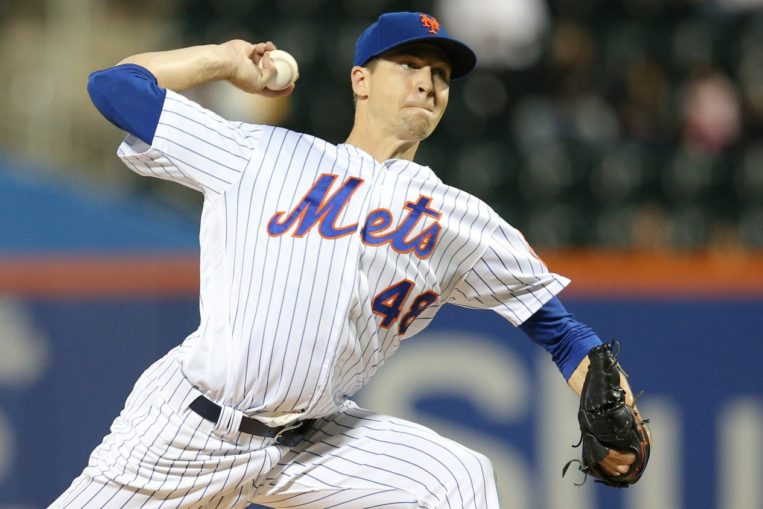
- Jacob deGrom
- Noah Syndergaard
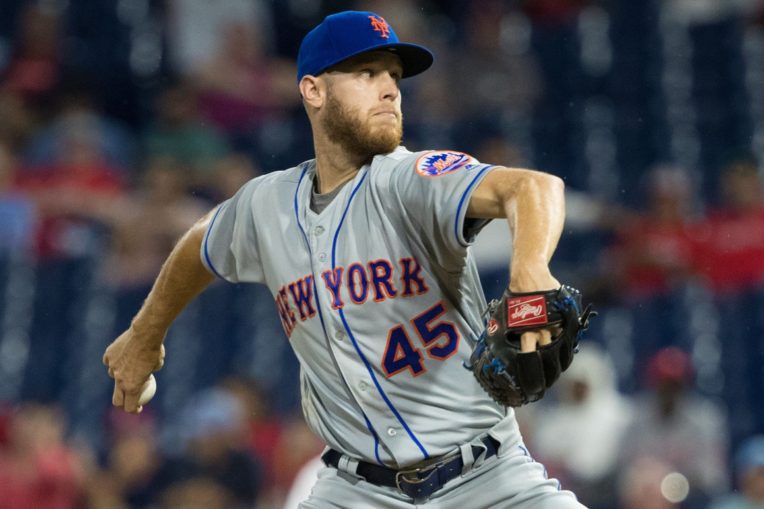
- Zack Wheeler
- Steven Matz
- Jason Vargas
Seth Lugo seems to remain a crucial bullpen piece, but he proved to be a valuable swingman at times. Corey Oswalt will also be around for some depth. With these five hurlers in mind, I was curious as to which particular outing was their very best from the 2018 season. To determine that, the second version of FanGraphs’ Game Score was used.
Jacob deGrom, September 26 vs. Atlanta Braves
The Game Score: 92
The Line: 8 innings, 0 runs allowed, 2 hits, 0 walks, 10 strikeouts
Some Eye-Popping Stats: In a year full of amazing performances, deGrom literally saved his best for last, putting a bow on what should be a Cy Young campaign. His second-to-last start against the Washington Nationals five days prior also was pretty damn good (seven innings of one-run ball, allowing three hits, one walk, and eight strikeouts).
Through his final 15 innings pitched of the season — both against National League East opponents — deGrom posted a 0.60 ERA with a 0.40 WHIP, 36.7% strikeout rate, and 2.0% walk rate. Opposing hitters mustered a .104 batting average, and the right-hander induced soft contact at a 40.0% clip to go along with a 13.3% hard-hit rate allowed. He did that off the strength of a 73.3% ground-ball rate.
The Highlights:
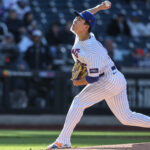
Noah Syndergaard, September 2nd at San Francisco Giants
The Game Score: 94
The Line: 9 innings, 1 run, 2 hits, 1 walk, 11 strikeouts
Some Eye-Popping Stats: After allowing four runs in six innings against the Chicago Cubs, Syndergaard said he was kind of wasting his ability to throw a baseball. A date with the Giants in his next start at AT&T Park certainly helped cure that, which also kick-started a strong finish to the year for him.
This particular start was Noah’s first career complete game. The 48.3% chase rate he generated was his highest of the season, while his 19.3% swinging-strike rate was his third-best mark. This was also one of four times in which he threw a first-pitch strike at a 70.0% clip. Three of the four occurrences overall came in the month of September.
The Highlights:
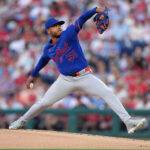
Zack Wheeler, September 12th vs. Miami Marlins
The Game Score: 85
The Line: 8 innings, 0 runs, 4 hits, 0 walks, 7 strikeouts
Some Eye-Popping Stats: Wheeler started his 2018 as a member of the Las Vegas 51s rotation, and is now primed to be a crucial piece to the big-league unit moving forward. Funny how baseball works sometimes, right? What’s so interesting about this start in particular is that Marlins hitters didn’t make any hard contact. Literally.
The right-hander induced soft contact at just a 5.0% clip, but he paired that with a 0.0% hard-hit rate allowed, 42.1% ground-ball rate, and 10.5% line-drive rate. He threw his curveball at an 18.0% rate, which was his highest single-game usage rate for this offering in 2018. It was obviously working well, too — he posted a 2.62 pitch value on a per-100-pitch basis. For some context, Corey Kluber led the league with a season-long curveball value of 3.05 on a per-100-pitch basis.
The Highlights:
Steven Matz, September 1st at San Francisco Giants
The Game Score: 74
The Line: 7 innings, 1 run, 3 hits, 1 walk, 11 strikeouts
Some Eye-Popping Stats: Matz actually had two starts with a Game Score of 74, but this one was chosen because he not only lasted longer in the game, but it was also the only time he broke double digits in the strikeout department this season. His 15.1% swinging-strike rate was his second-best performance of 2018, but Giants hitters chased balls out of the strike zone just 26.8% of the time.
The only other time his swinging-strike rate was above 15.0% was in July against the New York Yankees (it was 15.2%). In that game, they chased 38.0% of the pitches he threw out of the zone. Like many of the Mets pitchers already discussed, Matz saved his best for last, and turned September into his best overall month — he posted a 2.51 ERA in 32.1 innings, along with a 30.5% strikeout rate, 10.9% walk rate, and .270 wOBA allowed.
The Highlights:
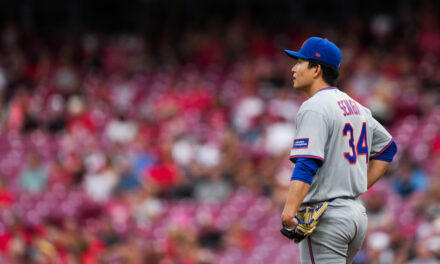
Jason Vargas, September 27th vs. Atlanta Braves
The Game Score: 80
The Line: 7 innings, 0 runs, 3 hits, 0 walks, 6 strikeouts
Some Eye-Popping Stats: The 2018 season wasn’t kind to Vargas, but he did have his spurts of productivity, and the theme of saving his best for last continued here. Of his 20 starts this past year, what he did in his final appearance against Atlanta was the only time he completed more than six innings, and it was just the fifth time he exited without issuing a walk.
His fastball was very effective, which obviously helped set up the rest of his arsenal. Vargas posted a per-100-pitch value of 7.04 with the ol’ number one in this start. That was the highest mark of his season, and only the seventh time he finished with a positive fastball value. And as bad as he was at times, the veteran southpaw actually enjoyed pitching at Citi Field — he owned a 3.92 ERA and .285 wOBA allowed in 39 home innings, compared to a 7.13 ERA and .394 wOBA allowed in 53 road innings.
The Highlights:


