It used to be you could tell when a ball was hit hard because it made a loud noise and it moved quickly through the air. Now, according to Baseball Information Solutions, you need an algorithm …
“BIS now records certain hard data (duration of hang time and landing location) with the observed hit type — liner, grounder, etc. — and then an algorithm decides if the ball is hard hit.” Neil Weinberg via Hardball Times. The actual algorithm is proprietary, so we have to take their word for what constitutes “hard contact,” but, generally speaking, the calculation is based on hang time, location, and trajectory.
I see it playing out something like this, David Wright lines out to Dee Gordon and as he’s taking his batting gloves off in the dugout he complains to Kevin Long, “Dagnabbit Mr. Long, I really thought I tattooed that one,” at which point Kevin Long pulls out a handy printout, “Sorry son, the algorithm says it was medium – see, right there.”
The truth is that the almost infinite diversity of statistics is one of the things that makes baseball so fascinating for so many. There was a time when a kid who saw [∂∂p−β(λ)∂∂λ+2(1−γ(λ))] G(2)(p)=0 in his head, when told to put a bunt down the first base line, would have no place on a baseball diamond. Now, the same kid can turn a soft blooper into a screaming liner with the right algorithm.
It’s amazing what data can tell you. For instance, it was recently discovered that guys like Giancarlo Stanton who routinely hit the ball hard, tend to be good hitters. A shocker, I know – there’s even proof in the form of a correlation study between wOBA and exit velocity.
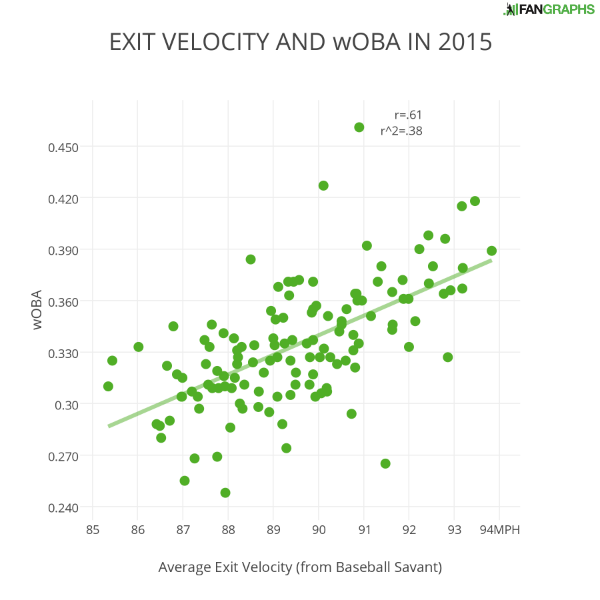
It’s not the biggest of correlations, but it’s there.
Ultimately BIS modified their approach with hang time and landing to presumably make it less of an abstraction. Previously hard/soft hit% data involved some guy who would watch the games and decide whether balls were hit hard, medium, or soft … I mean, if he drops a melted cheese Dorito on his vintage Jethro Tull jersey, it can skew the results. So the algorithm is a good thing in spite of my incessant persiflage.
But technology is only good if you can use it, and for the life of me I can’t figure out why StatCast exit velocities have yet to be employed quantifying hard and soft hit%. There are limitations (StatCast has trouble with weak contact) but the potential to disambiguate contact rates at the initial judgment level is tremendous. There is in fact some preliminary data showing that StatCast exit velocity correlates closely with hard% contact, which I’m sure brought a sigh of relief from the guy with the stained Jethro Tull shirt — who may want to keep his job options open nonetheless (I hear UZR is hiring).
Over the past few seasons, indications are that soft and medium contact rates have risen in MLB while hard contact has fallen. Teams have increasingly delved into contact rates in an effort to improve, and for good reason. A top 10 leaderboard for hard% contact features dignitaries such as Mike Trout, Paul Goldschmidt, Bryce Harper, and Miguel Cabrera (by the way Lucas Duda comes in at #11).
The Mets had a 31.5% hard contact rate in 2015, good for best in the game. The Mets are also tied for the fourth lowest hard% contact rate allowed (27.5%). Now there are lots of reasons teams succeed, but you have to think that the ability to make solid contact while preventing the opposition from doing the same gives you quite the advantage.
Sure enough the 2015 Mets made it to the World Series where they faced … the Royals with their 22nd in the league hard% contact rate and their 19th in the league hard% contact allowed … nothing to write Dorothy about. The Royals also had the lowest line drive percentage (19%) in all of baseball, while the Mets were third (22%).
The 2015 Mets hit the ball with authority more than just about anyone, which is very much in line with their selective philosophy – wait for your pitch, square it, clobber it. Yet they were beaten by a team who threw quality contact out the window in favor of plain old ordinary contact. The Royals led the league in contact% with an 81.9% mark.
KC also gave up quite a lot of hard contact (29.3%) but compensated with a top-notch defense. For the Mets, on the other hand, it didn’t make much sense to spend a lot of time or money on defense, given their high-K pitching staff and relatively low hard% contact rate (27.5%). The Mets looked like the better team, yet the Royals, a catch and throw outfit designed to spray the ball around, beat them in 5.
It’s doubtful that Dayton Moore, knowing his Royals were destined to play the Mets in the fall classic, specifically designed a team that would act as their ultimate foil … but it felt that way. The Mets vs. the Royals in the World Series was a tale of quantity trumping quality. In the end, the Royals were able to scrape enough runs together by putting the ball in play, while many a Met line drive ended up in a Royal mitt.
Still, the ability to hit the ball hard has to count for something, and, given the correlations (below) between that skill and other offensive indicators, (not to mention the wOBA / EV chart above), I’d hesitate to scrap the pursuit of quality contact in favor of increasing overall contact.
Correlations:
R2 with ISO: 0.70
R2 with SLG: 0.63
R2 with wRC+: 0.57
(Courtesy of Hardball Times)
From the Mets perspective it’s hard to find fault. Chances are they won’t have to face this same Royals team again in a World Series, and there’s a good chance that if they do, they could just as easily beat them. I’m also not sure there’s an overarching lesson here … for instance, in spite of the fact that the Mets lost to the Royals, I’d take hard contact over more “general” contact, because, again, according to the correlations above, it means you have better hitters. Furthermore, if you’re facing a team that can field, that’s all the more reason to hit the ball hard – anybody can make the routine play.
If there’s a caveat it’s that defense has to be more than an afterthought. The most ambiguous and unwieldy of all the branches of Sabermetrics, defense it turns out was the Mets’ Achilles heel all along. Hard contact will play as will power pitching, but if you are going up against a team who puts the bat to the ball, you’d best be able to field.
The Royals had an insane 59.6 dWAR in 2015, easily tops in the game (26.7 points ahead of the second place team). The Mets? 17th, with a 2.3 dWAR. In 2015, the Royals had 24.4 more defensive wins above replacement than the Mets.
If I’m Sandy Alderson, I am all of a sudden very interested in recalibrating the value of defense in a seven game series and I’m checking to see whether StatCast velocity data comes in a dry aerosol.


