If there’s one thing that’s been great about 2020, it’s the continued breakout of New York Mets infielder/outfielder, J.D. Davis.
After beginning the regular season 0-for-6, Davis has rattled off a 13-game hitting streak, collecting yet another hit in the Mets’ series finale victory on Sunday against the Miami Marlins. As New York has had to deal with injuries over the last couple weeks, Davis has shifted from left field to third base and has shown some nice glove work as an added bonus.
J.D.’s first 58 plate appearances of the year couldn’t have gone much better — he’s slashing .327/.414/.531 with three home runs, 11 RBI, and a 167 wRC+. His performance is more of what we saw last year when he slashed .307/.369/.527 with a 136 wRC+ in 453 plate appearances. And while he was productive for the entirety of 2019, there was a noticeable lift following the All-Star break.
Davis entered the midsummer break with an .809 OPS and 114 wRC+. He outperformed both those numbers handily in the second half (.979 and 156, respectively). With this in mind, I was curious how certain aspects of his second-half surge compares to what he’s currently accomplishing. Although there are some similarities, I’m going to focus on the differences, which you might’ve guessed after reading the headline.
(2020 statistics mentioned don’t include Sunday’s game, unless otherwise noted.)
Changes in Approach/Execution
When looking strictly at Davis’ swing rate, what he did in the second half of 2019 (48.5%) basically mirrors what he’s doing right now (48.4%). There’s a difference in how exactly that breaks down in certain scenarios, though.
Davis’ chase rate has gone up from 28.1% to 33.6%, while his swing rate on strikes has gone down from 74.1% to 70.6%. This makes the actual execution and results of these swings much more important. While his contact rate on balls outside the strike zone has gone down, his contact rate on strikes has gone up drastically, from 79.7% to 91.7%.
Heading into Sunday’s action, that contact rate was among the top 35 in baseball, and nearly identical to superstar Francisco Lindor (91.5%). Is it sustainable? Well, who knows. Either way, good things are bound to happen when you combine this kind of contact rate with a 44.1% hard-hit rate.
It’s also worth noting that Davis has been using the whole field a lot more often in the early going this season. Those efforts were on full display when he provided some insurance with a three-run homer on Saturday night:
JD DAVIS WITH A THREE-RUN HOME RUN. 🗣️ INSURANCE RUNS! pic.twitter.com/7tjIMhYjas
— SNY (@SNYtv) August 9, 2020
The proof is in the numbers, too. Here’s a look at how the distribution of his batted balls has changed between the two periods of time we’ve been talking about.
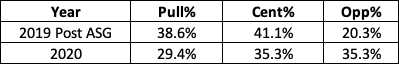
This is a trend that’s prevalent in all situations. While he’s still pulling grounders at a 40.0%-plus rate, it’s decreased from last year. The most notable difference comes when he puts the ball in the air — 50.0% of his fly balls have gone to the opposite field, as have 62.5% of his liners.
Changes in Batted-Ball Profile
Speaking of Davis’ batted-ball profile, that’s the perfect segue. Almost as if I planned it.
Following the Mets’ acquisition of J.D., one of the biggest things to watch was his ground-ball rate. In limited time with the Houston Astros, he couldn’t get that percentage below 50.0%. His season-long number from 2019 was 47.0%, but it improved greatly after the All-Star break. Here’s how that period of time compares to 2020 thus far, prior to Sunday’s game:
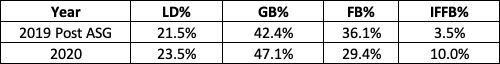
The ground-ball rate is creeping back up toward 50.0%, but the production is still there. What gives?
There hasn’t been a huge shift in results for Davis when hitting fly balls (269 wRC+ in ’19, 312 so far in ’20) or line drives (315 in ’19 to 375 so far in ’20). The shift in ground balls has been eye-popping, though — he owns a .375 average when he puts the ball on the ground, good for a 119 wRC+.
Obviously, the next question is: exactly how sustainable could this be? Those numbers may not remain up at that level for the duration of this season, but J.D. has been trending in this direction since debuting for Houston. Here’s a look at how his pull rate, hard-hit rate, batting average, and wRC+ have progressed each year since 2017.
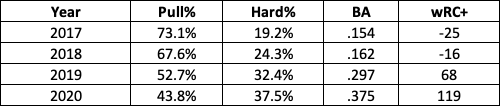
J.D. just may always hit more grounders than the average big-league hitter, but as long as it doesn’t kill his overall production or take away from what he can do in the power department, everything is gucci. With this year’s shortened regular season, I was interested in seeing how Davis would continue progressing from last season’s breakout. It’s awesome to see his production and maturity as a hitter keep trending upward. Let’s hope it doesn’t stop because New York can use every bit of offense it can get right now.


