
Tom Verducci published an excellent piece earlier this week about what he calls, “The Mystery of Flushing”. The quick and dirty of it is that the Mets have consistently run a far lower batting average on balls in play at home than they have on the road—without a discernable cause— and the end result is that the Mets’ home offense has struggled significantly. Here is a reproduction of the chart Verducci used to illustrate these struggles:
| Year | Home BABIP | MLB Rank | Road BABIP | MLB Rank | BABIP Difference |
|---|---|---|---|---|---|
| 2018 | 0.262 | 30 | 0.305 | 5 | -43 |
| 2017 | 0.273 | 30 | 0.300 | 11 | -27 |
| 2016 | 0.271 | 29 | 0.293 | 24 | -22 |
| 2015 | 0.272 | 30 | 0.301 | 10 | -29 |
| 2014 | 0.266 | 30 | 0.305 | 8 | -39 |
| 2013 | 0.273 | 30 | 0.309 | 6 | -36 |
Batting average on balls in play generally hovers around .300 for individual players, though there are certainly many exceptions to the rule. The Mets have been known to chase after three-true-outcome players in free agency, players like Curtis Granderson and Todd Frazier, who usually produce home runs, strikeouts, and walks and run low averages on balls in play—but that philosophy doesn’t excuse why the team has such offensive struggles on the road compared to home when their BABIP is roughly average-to-above-average on the road.
In other words, the Mets are performing as one might expect a good offensive baseball team to perform on the road—but they perform ineptly while at home. Hence, the mystery—we cannot simply say that “The Mets are bad at home because they’re bad” because their offensive performance on the road is actually quite good.
Let’s talk a bit about why teams might have problems like these. I have plotted the home/away BABIP differential for every MLB team since 2002 and highlighted the Mets’ differential in blue.
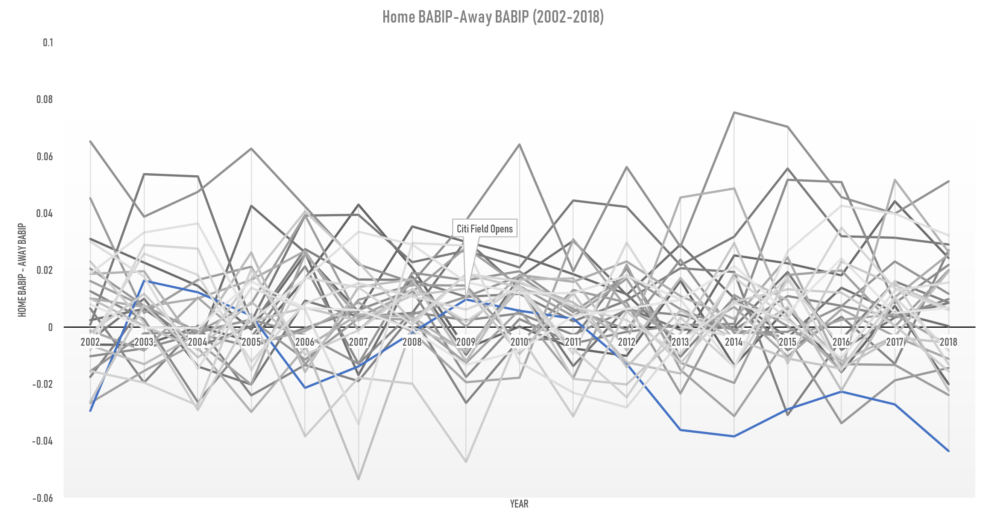
The Mets had a roughly even differential during their time at Shea, and while that appeared to continue with the opening of Citi-Field, around 2013, their home BABIP tanked and has remained poor ever since.
However, crucially missing from Verducci’s article is a discussion of BABIP allowed differential. I’ve again plotted the Mets in blue on the backdrop of the rest of the MLB.

I will call your attention to the scale of this chart—the degree of variation with this chart is much smaller than that of the previous chart, as rather than representing the BABIP talent of the Mets’ hitters, it instead represents the BABIP talent of the Mets’ entire pitching staff, which tends to be less volatile than that of individual hitters.
But the big takeaway is that the Mets’ pitchers (and therefore, Mets’ opponents) have had similarly low BABIPs at home against the Mets over roughly the same time period. There is a good amount of variation, but the general trend is that both the Mets and their opponents have run lower-than-average BABIPs while playing at Citi Field. The mystery is less “Why do the Mets run such low BABIPs at home?” and more “Why does Citi Field limit BABIP?”
It certainly appears as though something changed at Citi Field around 2012-2013. We can view this through the lens of ESPN’s park factors, which calculate how frequently certain plate outcomes are produced at some fields compared to a neutral field in a given year (a perfectly neutral park has a coefficient of 1.00 for a given plate outcome, and anything greater than one means that the park yields that plate outcome more frequently). Here are the park factors for runs, home runs, and hits at Citi Field (note that ESPN’s park factors can be quite volatile, as they are only for one season as opposed to their multiple-season-regressed form from FanGraphs).
| Year | Runs PF | HR PF | H PF |
|---|---|---|---|
| 2009 | 0.943 | 1.057 | 0.955 |
| 2010 | 0.890 | 0.719 | 0.934 |
| 2011 | 0.908 | 0.735 | 0.962 |
| 2012 | 0.874 | 1.069 | 0.918 |
| 2013 | 0.867 | 1.120 | 0.894 |
| 2014 | 0.847 | 0.956 | 0.918 |
| 2015 | 0.870 | 0.994 | 0.912 |
| 2016 | 0.988 | 1.090 | 0.887 |
| 2017 | 0.858 | 0.798 | 0.880 |
| 2018 | 0.735 | 0.889 | 0.833 |
It is of considerable note that home runs spiked a lot from 2011-2012, and remained consistently high until around 2017, while the park factors for hits have been consistently down and have never reached pre-2012 levels. It is also of considerable note that prior to the 2012 season, the Mets moved in their fences to help boost home runs. Home runs are not included as a part of balls in play (the formula for BABIP is (hits – home runs) / (balls in play – home runs)) – so perhaps by moving in the fences, the Mets traded some home runs for balls in play.
Maybe there is something else at play. Perhaps there is some year-to-year variation that has just fallen against the Mets when it could have just as easily fallen for them. Maybe there is a hidden factor that’s resulting in fewer balls in play. Maybe the Mets just really hate playing in Citi Field. But at the very least, during Citi’s stretch of BABIP mediocrity, home runs have generally been up, and hits have generally been down—one might very easily be playing into the other.


