
Last month, Tom Tango introduced Baseball Savant’s newest tool: Statcast Swing Take.
Every other calculation that the folks at Baseball Savant have created has taken into account the bigger picture of a baseball game: the value of a certain hit, the probability of that hit in terms of exit velocity and launch angle, and the sprint speed. But no other metric had focused on the smaller picture; how swinging at certain pitches impacted a player’s value.
Statcast Swing Take values a player’s at-bat by calculating their damage based on the pitch’s location, the count, and the player’s decision to swing or take (hence the name). While it’s difficult to understand at first, this metric helps determine how many runs a player has contributed to their offense by taking or swinging at certain pitches.
There are four different aspects to this new tool: a Zone Profile, Pitch Frequency circles, a Swing/Take percentage chart, and a Run Value graph. Below are Mike Trout’s Swing Take charts.

The Zone Profile evaluates if a player has been swinging at pitches that he can hit well against and how’s he’s done at deciding which pitches to swing at based on location. The Total Run Value, located on above The Zone Profile, adds up all of a player’s Run-Value contributions from each of the four zones.
There are four different types of Attack Zones in the Zone Profile: The Heart Zone, The Shadow Zone, The Chase Zone, and The Waste Zone.
As Tango explains, the majority of the batter’s damage takes place in The Heart Zone, also called The Heart of the Plate. This is where the majority of meatballs, the pitches that batters usually barrel, are located. Hitters swing at these pitches in this zone 73% of the time.
Surrounding it is The Shadow Zone. Pitchers tend to induce swings or misses from pitches located in this zone and when batters make contact from pitches in The Shadow Zone, it’s usually harmless flares/burners. The Strike Zone is located in between The Heart Zone and The Shadow Zone.
Just outside The Shadow Zone is The Chase Zone. Kinda self-explanatory. Pitchers like it; Batters try to lay off pitches thrown in this Zone.
The final zone is The Waste Zone. It’s even less hitter-friendly than The Chase Zone. If a batter’s frequently swinging at pitches in this zone, they should get their vision checked out or Alfredo Griffin’s in the batter’s box.
Runs Value, which is used in both the Zone Profile and Run Value chart, is computed by taking the value of certain plate outcomes (such as a walk, single, type of out) and calculating how many runs it is worth. Baseball Prospectus lists its definition as “number of runs to score from a particular event based on historical context”.
The Fangraphs Guts pages show us that in 2019 a single is worth .87 of a run while a home run is worth 1.94 runs. This Runs Value chart shows the specific Run Values for each different pitch count, which is a major component of the Runs Value shown in each player’s Swing Take profile.
Next to the Zone Profile is the Pitch Frequency Chart. It shows how many pitches were thrown to each batter in each zone along with a league-average mark in 2019. For example, the average MLB pitcher threw to The Heart Zone 25% of the time in 2019.
Located next to it is each player’s numbers and the league-average numbers when it comes to swinging or taking in each zone. This chart is called the Swing/Take Percentage chart.
On the far right side of the chart shows a player’s Runs Value for each Zone. Each Runs Value, which is calculated by Tango’s Algorithm, calculates a player’s production based on swings or takes in each zone.
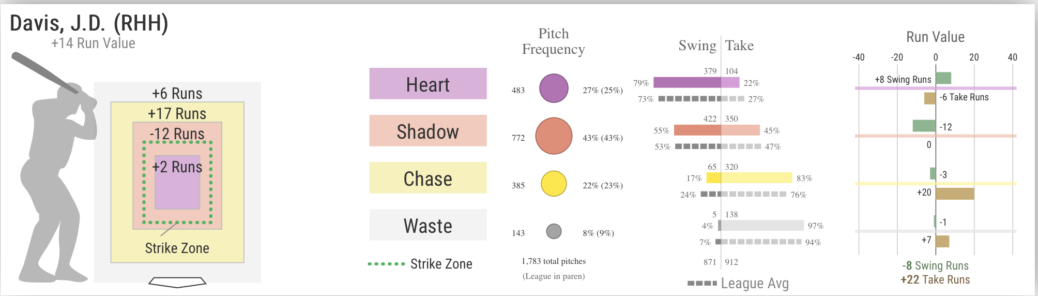
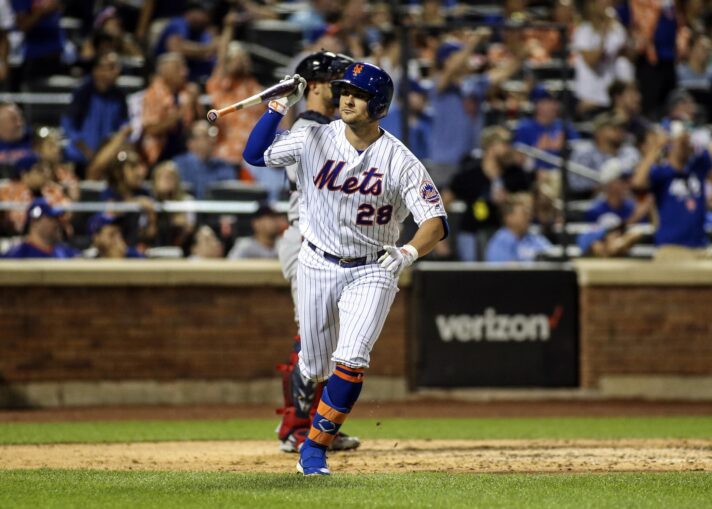
Above is J.D. Davis’s Swing Take profile.
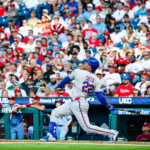
In his first year in a Mets uniform, Davis quickly made himself a fan-favorite. He was given a full-time job midseason and ran with it, finishing with his season with .307/.369/.527 slash line along with 22 HR, 57 RBI, and a 2.4 fWAR/1.0 rWAR. Davis’ hard-hit percentage, xwOBA, and exit velocity all ranked in the top 10 percent in the Majors.
On the left, we can see Davis’ Zone Profile and which zones Davis did his damage in.
Davis’ chart shows his Run Value in The Heart Zone as +2. We can see on the Run Value chart over on the right that when he swings at pitches in the middle of the plate, he does damage, as indicated in his +8 run value. But he draws a -6 run value from taking pitches in The Heart Zone. So a +2 Run Value.
But in The Shadow Zone is where he needs to start producing more. It’s where pitchers tended to throw to him in 2019 and for good reason, he wasn’t doing much with those pitches. While his 0 take runs isn’t a spectacular mark, it’s his -12 swing runs that is really concerning.
When he’s swinging at pitches in The Shadow Zone, he’s doing nothing productive. He has a Z-Contact Percentage of 78.6% (the percentage of times that he made contact inside the strike zone), which is 6.3% below the league average. Since the strike zone is located inside The Shadow Zone, his below-average Z-Contact percentage shows that he’s employing a way-too patient approach, which led to his 0 take runs. Additionally, he’s whiffing at 10.2% of the pitches in The Shadow Zone, a mark that is well above the league average of 6.2%, which led to his -12 swing runs. He’ll need to work on making more effective contact in The Shadow Zone in order to enjoy another successful season in 2020.
But he makes up with an excellent showing in The Chase Zone. He swung at only 17% of the pitches in this zone, a mark that’s 7% less than the average batter. When he swings in The Chase Zone, he’s doing well, as indicated by his .323 xwOBA in this zone, which is .31 points ahead of the league-average mark of .292. He’s produced a +20 Run Value taking pitches in this zone compared to a -3 Run Value while swinging at pitches this zone.
Quick reminder that The Chase Zone is outside the strike zone so Davis is helping himself by recognizing to lay off pitches in this area. Since this is primarily the zone pitchers use when they want hitters to swing out of the strike zone and “chase”, he benefited himself a lot by not swinging much there in 2019. That’s why his +20 Run Value on The Chase Zone is among one of the best marks in the MLB. It could also be one factor that prompted his breakout season.
His numbers in The Waste Zone aren’t anything special. His takes in this Zone are slightly above-average, which led to a +7 take Runs value. However, players are virtually expected to post positive numbers in this area so while it’s certainly nice that he did well in this area, it’s nothing that shouldn’t be expected.
While Davis had himself a year in 2019, his 2020 campaign could be even better if he can learn to make more productive contact in the Shadow Zone.


