Opportunity cost is an economic term that means the highest valued alternative foregone to pursue an activity.
It’s like if you worked at a bakery baking cakes and pies. Your shift is five hours long. In one hour, you’re able to bake one cake or two pies. If you spent zero hours on cakes and five hours on pies, you would have zero cakes and 10 pies at the end of your shift. If you spent one hour baking cakes and four hours baking pies, you would have one cake and eight pies—and so on and so forth. For every hour you spend making cakes, your opportunity cost is two pies.
I applaud you for making it past this introduction. Thanks for bearing with my baking analogy. The reason I bring up opportunity cost is because there are many things it can be applied to—like the Mets’ bullpen for example.
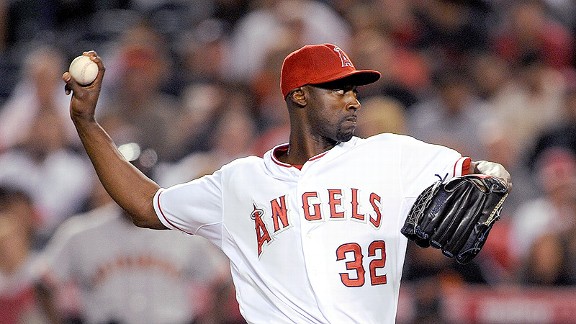
This offseason, the Mets have focused on tweaking their ever-underachieving bullpen. Jon Rauch will take his 3-7 record and 50-percent save-rate talents to South Beach. Ramon Ramirez will jet back to the West Coast—hoping everyone in the Bay missed his subpar 2012 season. Good thing we have Frank Francisco locked up for another year at $6.5 million…

The Mets have plenty of options. As a result, the bullpen has struggled to find an identity. Here are some of the relief acquisitions the Mets have made this offseason:
I’ve looked at all the Mets’ relief pitchers to see whose numbers are best in particular innings. Over the next couple of weeks, I’ll break down the best potential candidates for the back end of the bullpen. While the Mets have a plethora of young bullpen arms, I decided to look at the players who had at least 10 innings pitched in that particular inning last year1.
Five players have 10 innings pitched in the 7th inning. Here are their stats.
- Scott Atchison: ERA – 2.76 / WHIP – 0.99 / BA – .220 / OBP – .258 / K/BB – 3.33
- Pedro Feliciano: ERA – 2.92 / WHIP – 1.16 / BA – .222 / OBP – .314 / K/BB – 1.75
- LaTroy Hawkins: ERA – 4.26 / WHIP – 1.39 / BA – .280 / OBP – .315 / K/BB – 2.00
- Brandon Lyon: ERA – 3.86 / WHIP – 1.43 / BA – .263 / OBP – .323 / K/BB – 3.00
- Bobby Parnell: ERA – 2.20 / WHIP – 1.43 / BA – .237 / OBP – .333 / K/BB – 1.56

One could say that Atchison’s stats are the best out of these relievers and he should pitch in the 7th. One could also say that his stats are more dominant in the 8th and that he should pitch there instead. Here are the qualifiers for the 8th inning:
- Scott Atchison: ERA – 0.00 / WHIP – 0.77 / BA – .174 / OBP – .208 / K/BB – 6.00
- Pedro Feliciano: ERA – 3.44 / WHIP – 1.56 / BA – .261 / OBP – .357 / K/BB – 2.06
- LaTroy Hawkins: ERA – 1.84 / WHIP – 1.27 / BA – .268 / OBP – .305 / K/BB – 3.00
- Brandon Lyon: ERA – 3.42 / WHIP 1.25 / BA. – .244 / OBP – .303 / K/BB – 3.43
- Bobby Parnell: ERA – 2.86 / WHIP – 1.41 / BA – .311 / OBP – .333 / K/BB – 5.00
If we apply opportunity cost, we would discover that the cost of playing Atchison in 7th is greater than if he pitched in the 8th. Opportunity cost can be measured by solving for the difference between his numbers in the 8th and the next best stat line in that inning. Then you compare it against all other innings he could potentially pitch in. For example, let’s compare the opportunity cost for Atchison pitching in either the 7th or 8th inning. Those are the only two innings he qualifies for. Arguably, the next best alternative in the 8th inning is Hawkins. Here are their 8th-inning stats side-by-side:
- LaTroy Hawkins: ERA – 1.84 / WHIP – 1.27 / BA – .268 / OBP – .305 / K/BB – 3.00
- Scott Atchison: ERA – 0.00 / WHIP – 0.77 / BA – .174 / OBP – .208 / K/BB – 6.00
Differences (all favor Atchison): ERA – 1.84 / WHIP – 0.50 / BA. – .094 / OBP – .097 / K/BB – 3.00
Compare that to the differences in the 7th between Atchison and Feliciano (arguably the best alternative).
- Pedro Feliciano: ERA – 2.92 / WHIP – 1.16 / BA – .222 / OBP – .314 / K/BB – 1.75
- Scott Atchison: ERA – 2.76 / WHIP – 0.99 / BA – .220 / OBP – .258 / K/BB – 3.33
Differences (all favor Atchison): ERA – 0.16 / WHIP – 0.17 / BA – .002 / OBP – .056 / K/BB – 1.58
To figure out the final opportunity cost, take the two sets of differences for each inning and find the difference between them.
Differences between 7th and 8th inning (all favor 8th): ERA – 1.68 / WHIP – 0.33 / BA – .092 / OBP – .041 / K/BB – 1.42
We do this because we’re assuming that he’s going to pitch in either the 7th or 8th inning. So if Atchison pitched in the 7th, you would still have to factor in the differences between him and Feliciano in that inning. They just don’t disappear.
If we assume that all these variables are true, then we can determine Atchison’s potential opportunity cost. Just looking at ERA, it would cost the Mets Atchison’s 1.68 if he pitched in the 7th rather than the 8th.
By interpreting the given information within these parameters, the best potential 8th-inning pitcher would be Atchison. It’s not completely scientific. Crazy things happen in baseball, but this gives us a more educated look at the Mets’ bullpen choices from an economic perspective.
I’ll be back with more projections later.
1I’m including Feliciano’s last season, which was in 2010 with the Mets. I would take his stats with a grain of salt considering he hasn’t pitched in two years. That being said, the Mets are in no position to be picky.


