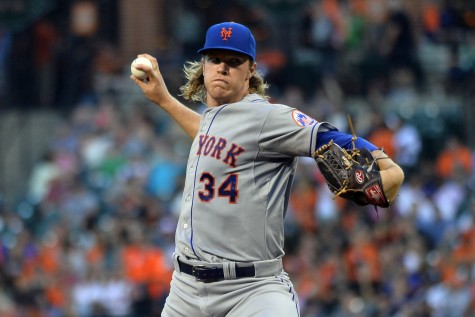
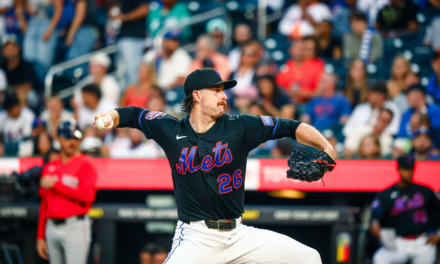
“I feel like with the exception of the first inning it was a pretty solid performance. A lot of people have been concerned about my performances on the road. I feel like this was a step in the right direction, as far as being more comfortable out there.” – Noah Syndergaard
Stat Line: (ND 7-6) 5 IP, 3 R, 8 H, 6 SO, 2 BB
Battling past erratic command, Noah Syndergaard’s sharp movement on his two-seam fastball and curveball coupled with a solid mix in pitch selection helped him evade complete disaster. This outing is a great example of being wild but not effectively wild as noted in previous Matt Harvey articles.
Harvey was wild within the strike zone, still maintaining a high strike rate. Conversely, Syndergaard continually threw pitches out of the strike zone leading to less swings and less weak contact.
Thankfully, Syndergaard’s curveball is an absolute hammer, exhibiting sharp 12 to 6 movement which produced a 34.4% miss/whiff rate. Otherwise, the Orioles would have started the carrousel around the bases.
Getting Behind, Staying Behind
Contrary to Jacob deGrom’s outing last night, Syndergaard consistently fell behind in the count.
As noted in yesterday’s article, the Orioles hit .297 with a .517 slugging percentage when ahead in the count this season. Conversely, the Orioles batting average is .202 with a slugging percentage of .324 when behind in the count.
Syndergaard fell behind in the count against 11 of the 24 Orioles faced (45%). He threw a first pitch strike to 14 of the 24 Orioles faced (58%). To understand those subpar percentages, in deGrom’s successful outing last night, he feel behind against 35% of Orioles faced and managed 78% first pitch strikes.
Another difference is deGrom throwing 70% total strikes versus Syndergaard’s 64% total strike rate. Major League strike rates below 65% are considered average to below average as opposed to an above average strike rate at or above 70%.
Additionally, less strikes early in an at-bat equate to less balls put in ball early in the at-bat leading to higher pitch counts. This lowers Syndergaard’s chances to gain a six inning quality start and pushes more innings on a bullpen that has faltered of late.
Control Running Game
As Keith Hernandez eluded to in the broadcast, Syndergaard’s high leg kick and slow rhythm in his pitching motion from the stretch translates to the ball taking too long to get to home plate.
Even worse, Syndergaard struggles mightily with holding runners on base. Too often he comes set, waits one second and begins his pitching motion.
This hit rock bottom last night after Chris Davis, who now has two stolen bases this season, took a walking lead off second base to steal third base. Gerardo Parra took advantage of this in the first inning, easily stealing second base.
Simply, Syndergaard needs to vary his time holding the baseball when he comes set in the stretch. Another way to vary his timing is attempting more pickoffs to first base even if he knows he won’t pickoff the runner.
He must improve on holding runners to minimize stolen bases before a potential playoff run. The importance of 90 feet is the difference between a double play ground ball and the opposing team advancing a runner from second to third with one out. This is how playoff games are won and lost.
Looking Forward
Syndergaard’s next start will come next week against the Philadelphia Phillies at Citizens Bank Park. On May 27th, he dominated the Phillies striking out six over 7.1 innings. Here is the pitching breakdown article from that game.
Stat of the Night
Last night, Syndergaard didn’t induce any soft contact registering a 0.0% soft contact percentage.
Statistics thanks to @BrooksBaseball PitchF/X Tool.

Follow Chris Zaccherio on Twitter @ziography for more Mets pitching insight that goes beyond statistics.


