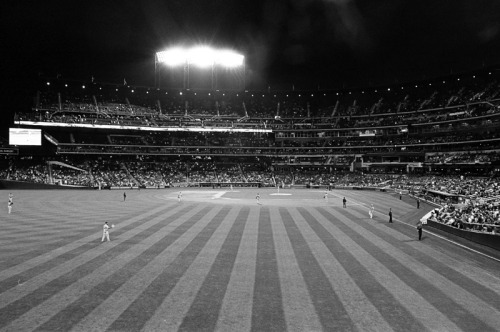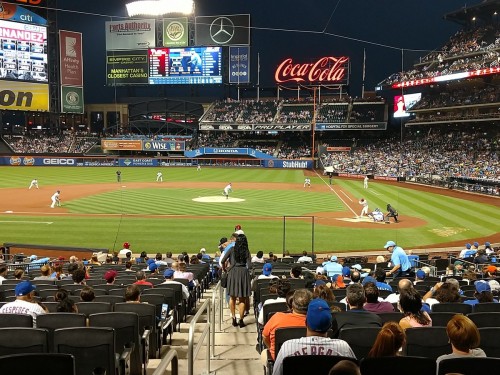
Even before the pandemic, baseball attendance was declining.
According to Ronald Blum of Boston.com, attendance was down in 2019 for the fourth straight season, the longest such streak in league history. Why? Perhaps young people are losing interest in the game. Perhaps the increasing polarization of team records, with multiple squads winning (and losing) over 100 games regularly, is driving fans away.
The New York Mets, though, saw their average attendance figures increase in 2019 vs. 2018, per Baseball Reference data:

Of course, there will be fluctuations in attendance numbers for individual teams regardless of the overall trends in the league. But this can bring us to an interesting question – what are the factors that really affect attendance the most? Why did the Mets succeed in boosting their numbers in 2019 when most teams didn’t?
Well, there was one obvious point – the team was simply better in 2019. Their average division rank for a home game in 2019 was 3.1, down from 3.5 in 2018.
But that wasn’t the only factor – they had a couple more weekend games, more big promotions, and a higher average temperature (as tends to happen now, season to season):

To go deeper into analyzing Mets’ attendance, I decided to build a linear model of their home games’ attendance based on a multitude of data on factors that I hypothesized could influence attendance, including:
- Whether or not it was Opening Day (we would expect attendance to be far higher for Opening Day than an average game, and this needs to be controlled for in our model)
- The month of the game (perhaps attendance rises or falls due to early/late season, independent of other factors)
- Whether the opponent was a division rival or not
- Whether the opponent was the Yankees or not (people just love to watch the Mets beat down the Yankees)
- What the Mets’ division rank was at the time
- Whether or not (and the significance of) there was a promotion for the game
- 0 for no promotion
- 1 for a Free Shirt Friday
- 2 for a more significant promotion, like a bobblehead or fireworks
- Whether or not it was a weekend (I defined weekend as Friday night through Sunday night)
- What the average temperature was the day of the game
- How much precipitation was measured the day of the game
I analyzed data over the past five years, from 2015 through 2019. The R output, for reference, was as follows:

In simpler terms, we found eight of our predicted variables had a statistically significant impact on (correlation with) attendance, concurrently (i.e., the effects are not independent of each other, but are all being controlled for at the same time).
Those variables, along with their coefficients (positive coefficient means a positive change in the variable leads to a positive change in attendance, and vice versa) and p-values (measure of statistical significance; a smaller p-value indicates higher confidence in statistical significance):

Interesting! Most of the results align with hypotheses – as expected, Opening Day and Yankees games have a huge positive impact on attendance, while the lower the Mets’ division rank, the more fans will fill the seats. More significant promotions, a higher temperature, and weekends also had positive impacts on attendance.
The more intriguing tidbits, for me: division games had lower attendance than average (perhaps fans are tired of seeing the Braves and Marlins over and over again, and prefer to switch it up with new visitors), as did night games (I guess nothing beats a day at the ballpark, though I suspect there could be some confounding going on with day games being more likely to be on weekends, which we already know have higher-than-average attendance).
We can dig a little deeper into each of these individual relationships, too. For example, though a lower division rank generally meant more fans, the impact really only seemed to be when the Mets were really bad:

In fact, the average attendance when the Mets were second in the division was higher than when they were in first (though as Mets fans can attest, samples tend to get smaller up at first and second place).
The real drop-off in fan count comes from third to fourth place, and then fall off a cliff at last place. Mets fans don’t necessarily need an incredible team to want to go to the park – they just need competency!
I also wanted to look into the promotions – how much did they really impact the fan count? I can say firsthand that fans will literally line up outside the stadium for hours for the chance to be one of the first 15,000 to grab a bobblehead of Noah Syndergaard as Thor or a garden gnome that looks like Jacob deGrom.
The attendance by promotion backs that idea:

However, as it is so often with data science, things can get even more intriguing – or counterintuitive – when we dig beneath the surface. If we further segment the bar chart to show the breakout on top of weekend vs. non-weekend games, there’s an insight to be gleaned:

Huh! It looks like on weekdays, the difference between “none” and “other” is pretty significant, but on weekends, it’s pretty indistinguishable!
Perhaps this is telling us that, to a certain extent, people are going to come to the ballpark on weekends regardless of the promotion, and the Mets are better served from a business perspective saving their cool bobbleheads for random Tuesday nights.
If one dude with R and Microsoft Excel can find all of this, imagine what an entire MLB analytics team can find. That’s why dynamic pricing – the ability for teams to change prices for their games on the fly based on factors like (and beyond) the ones explored here – can be so important for the teams as businesses.
Airlines have been using strategies like this for years, but within sports, so have third-party sellers like StubHub. It’s only recently that the source – teams themselves – have started to get in on the fun. And when sports come back, after heavy COVID-based losses, they’ll need to do everything possible to make sure that they are maximizing their revenues when possible.
The nice part about the teams doing it themselves is that they can impose ceilings and floors on prices by game. A lot of a team’s public perception, of course, depends on the prices they set. With that in mind, they can protect prices from falling so low that their valued season ticket holders lose excess value, and from getting so high as to cause an uproar.
The Mets should certainly implement a strategy like this, where algorithms can take factors like team performance, weather, etc. and set prices so as to maximize profit based on a consumer’s projected willingness to pay (within their chosen constraints).
And who knows? With how starved people have been for sports the past few months, perhaps baseball can see a renaissance in its per-game attendance numbers for the first time in years.


