An MMO Fan Shot by Daniel Marti
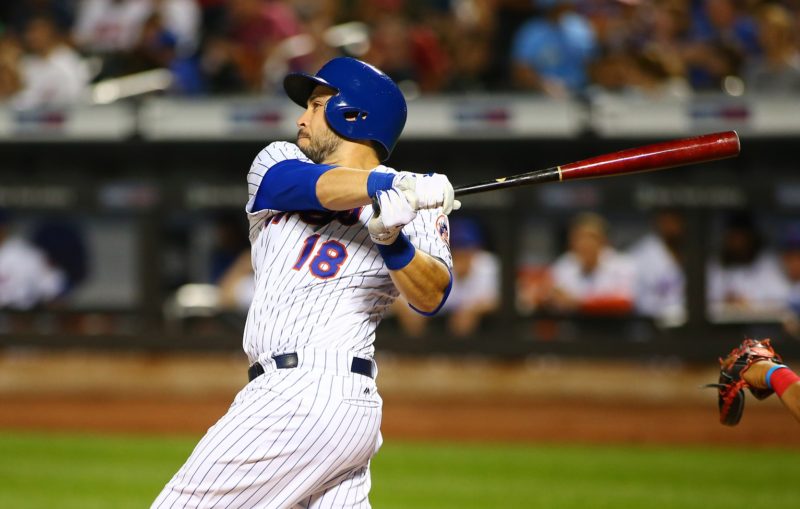
Travis d’Arnaud was once one of the top prospects in all of baseball in 2013. Five years later, much of the sheen of the once-prized catcher has now worn off. d’Arnaud struggled in 2017, slashing a meager .244/.293/.443. However, he gave fans hope for better days by producing a .297/.343/.656 slash-line this past September.
Looking at his entire body of work in the majors, d’Arnaud has a career slash-line of .245/.306/.406 which is good for a wRC+ of 96. While this doesn’t look too impressive, the fact that d’Arnaud is a catcher and that offensive production at the position overall has been quite weak in recent years must be taken into account. This begs the question, does Travis d’Arnaud really give the Mets average production when comparing him to other catchers around the league?
At a glance, the average slash-line for catchers was .246/.315/.410 in 2017. While this makes d’Arnaud’s 2017 (.244/.293/.443) seem palatable, I don’t believe that looking at the average production from the catcher position is the best way to judge him.
Utilizing the average production of catchers league-wide as a benchmark signifies that we must include all catchers who have made at least one PA during the season in our analysis. The problem with this is that a bunch of bottom-tier guys or backups will skew the averages negatively. For example, former Met Anthony Recker slashed .143/.143./143 in 7 plate appearances for the Atlanta Braves in 2017. Recker’s production, along with other catchers of his ilk, will bring the average production figure down, thus making d’Arnaud’s numbers look better than they actually are. I believe that d’Arnaud should be compared to other starting catchers and not to fringe major leaguers. This should be the true measure of success and performance as d’Arnaud will be the starting catcher for the Mets in 2018, for better or for worse.
To do this, I believe we should look at the actual positional rankings and see where d’Arnaud lies. Instituting a criterion of a minimum of 300 plate appearances will give us a population of 33 catchers. Here are d’Arnaud’s rankings by a few statistics that I thought were important and/or interesting:
| 2017 Travis d’Arnaud Catcher Rankings (Min 300 PA) | ||||
| OBP | OPS | wRC+ | WAR | |
| Value | .293 | .735 | 91 | 0.8 |
| Rank | 27 | 19 | 24 | 27 |
I’m aware that the ranking approach is also flawed. Rankings can make hitters with similar numbers appear more disparate than they are regarding their performance. For instance, the OBP for the #5 ranked catcher (Wilson Contreras at .356) is not too far off from that of the #10 catcher (Gary Sanchez at .345). To help address this problem, we can establish tiers of production to better judge each player.
| OBP | OPS | wRC+ | WAR | |
| Tier A | Greater than or equal to .340 | Greater than or equal to .830 | Greater than or equal to 120 | Greater than or equal to 2.5 |
| Tier B | .319 – .339 | .750 – .829 | 100 – 119 | 1.8 – 2.4 |
| Tier C | .298 – .318 | .700 – .749 | 83 -99 | 0.9 – 1.7 |
| Tier D | Below .298 | Below .700 | Below 82 | Below 0.9 |
Below you’ll see the number of qualifying catchers that fall into each tier:
| OBP | OPS | wRC+ | WAR | |
| Tier A | 12 | 8 | 9 | 10 |
| Tier B | 7 | 10 | 7 | 8 |
| Tier C | 6 | 10 | 11 | 8 |
| Tier D | 8 | 5 | 6 | 7 |
Here is where Travis d’Arnaud ends up using this system:
| OBP | OPS | wRC+ | WAR | |
| Value | .293 | .735 | 91 | 0.8 |
| Tier | Tier D | Tier C | Tier C | Tier D |
Using the tier system as our lens for analysis, d’Arnaud still is less than impressive. He falls in the bottom two tiers in each of the categories I used. His OBP, a statistic with one of the highest correlations to scoring runs, is very low even when compared to other qualifying catchers.
You could make arguments for d’Arnaud’s wRC+ and OPS being just about average since most catchers fall into Tier C, but his numbers were inflated by a hot September at the plate. Compare his September wRC+ of 157 to those he produced in April, May, June, July, and August (113, 60, 95, 62, and 44 respectively). It is highly unlikely that d’Arnaud could sustain that level of success over the course of a full season, especially given his susceptibility to injury.
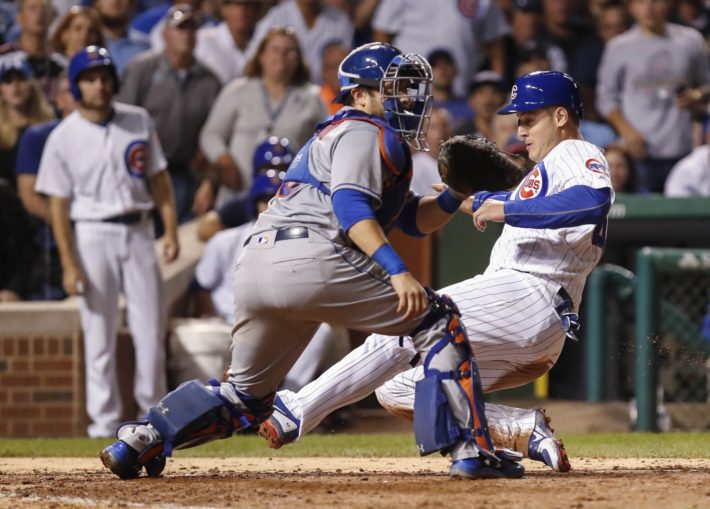
Now let’s talk about Travis d’Arnaud’s defense. Though defensive metrics are far from reliable, especially when it pertains to catchers, we can use them to help us gain a clearer picture of how d’Arnaud performs behind the plate. Using a similar approach, I set a criterion of a minimum of 300 innings at catcher which gave me a population of 61 catchers. Here is how d’Arnaud fared against his contemporaries using DRS (Defensive Runs Saved) and rSB (Stolen Base Runs Saved):
| 2017 Travis d’Arnaud Catcher Rankings (Min 300 Inn) | ||
| DRS | rSB | |
| Value | 0 | -4 |
| Rank | 26 (tied with 5) | 57 |
Now let’s use the tier system just how we did with the hitting statistics:
| DRS | rSB | |
| Tier A | Greater than or equal to 5 | Greater than or equal to 3 |
| Tier B | 0 – 4 | 0 – 2 |
| Tier C | -3 – -1 | -3 – -1 |
| Tier D | Below -3 | Below -3 |
Here are the number of qualifying catchers that fall into each defensive tier:
| DRS | rSB | |
| Tier A | 12 | 14 |
| Tier B | 19 | 23 |
| Tier C | 16 | 15 |
| Tier D | 14 | 6 |
Finally, let’s see how Travis d’Arnaud stacked up against his peers:
| DRS | rSB | |
| Value | 0 | -4 |
| Tier | Tier B | Tier D |
Surprisingly, d’Arnaud ranks as an average catcher defensively. While he is among the very worst in the league pertaining to controlling base-runners, this is mitigated by the fact many teams seem to be shying away from base-stealing overall. Personally, this does not inspire much confidence as an astute manager can take advantage of d’Arnaud by sending as many base-runners as possible to steal.
Again, these numbers are to be taken with a grain of salt since they do not account for other important skills such as game management. Let’s not forget that the best pitcher on the team, Noah Syndergaard, opted to use Rene Rivera as his personal catcher over d’Arnaud. There still seems to be much room for development in handling a pitching staff for d’Arnaud.
Factoring in both offensive and defensive performance, d’Arnaud is below average. Although arguments could be made for d’Arnaud being average, I believe doing so would be a little generous, at least for his 2017 season. He was below league-average at the plate and questionable defensively, despite the his 2017 DRS of 0. I think the best way to describe d’Arnaud is that he isn’t bad enough to replace, yet.
The Mets shouldn’t squander any of their precious resources acquiring a catcher outside of the organization. In 2017 the 26-year-old Kevin Plawecki finally demonstrated why he was a highly-touted prospect in his own right by slashing .260/.364/.400 (good for a wRC+ of 106) in limited playing time. A tandem of d’Arnaud and Plawecki could bring the best out of both catchers by driving them to compete against each other for playing time while also allowing them to have ample rest throughout the rigors of a 162-game schedule.
A tandem of Travis d’Arnaud and Kevin Plawecki may be the best option at catcher for the Mets moving forward.
* * * * * * * *
This Fan Shot was written and contributed to MMO by reader and die-hard Mets fan Daniel Marti. Have something you want to say about the Mets? Send your article to [email protected] or use this Contact Form. Or ask us about becoming a regular contributor.


