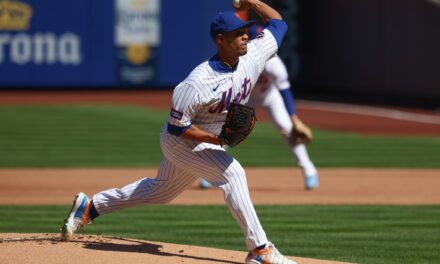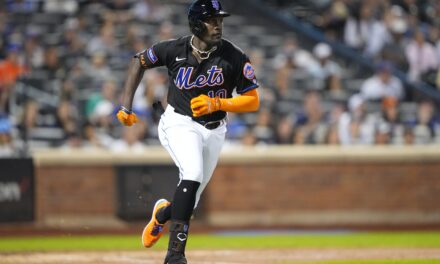
As we sit here on July 2nd at 40-40, we see a New York Mets pitching staff that has rigorously outperformed their defensive and hitting production. In this mid-season pitching report card, I give both a statistical and non-statistical review for each Mets starting pitcher through June 30.
Listed below are the statistical categories that I use in this evaluation and the reasons those statistical categories are important in evaluating each starter. Provided is a link to @FanGraphs as they do a great job of providing a more comprehensive explanation on each statistical category.
- K/9 aka Strikeouts Per Nine Innings: Although a pitcher can succeed with a low strikeout rate, strikeouts can not only show the quality of a pitcher’s repertoire and sharp movement in their pitches but also helps indicate how well a pitcher can get out of troublesome innings. Rates above eight are very good while rates above ten can be viewed as exceptional.
- K to BB aka Strikeout to Walk Ratio: This is another great indicator for how sharp and devastating a pitcher’s ball movement is but also shows how well a pitcher commands their ball movement within the strike zone. Ratios above four are very good while ratios above seven are exceptional.
- ERA aka Earned Run Average: In todays game, more and more importance is put into sabermetrics and many of the traditional statistics are viewed as out dated. Although ERA can be deceiving, it is still a great measure of a pitchers success over a larger sample size, like a half season of games. ERA helps determine the overall success of a pitcher based on the amount of runs the allow. This reveals a pitchers ability to consistently pitch well and battle through the outings where they may not have their best repertoire of pitches. Averages below 3.40 are very good while a rate below 2.50 can be viewed as exceptional.
- FIP aka Fielding Independent Pitching: This formula incorporates only what the pitcher can control: homeruns allowed, strikeouts and walks thus excluding the effects of their fielders behind them. FIP is easy to interpret as it is designed to look like the more commonly used ERA. Rates below 3.50 are very good while rates below 2.75 are viewed as exceptional.
- HR/FB Percentage: Homerun to fly ball percentage is a sabermetric that should never be used independently but when used with other statistics does help evaluate how lucky or unlucky a pitcher is in giving up homeruns per fly ball allowed. The league average is 10% with percentages above 12% considered unlucky and percentages below 8% considered lucky. Over the course of a season, it’s fair to assume that a pitchers percentage will regress to the league average of 10%. This allows us to forecast the amount of homeruns a pitcher will likely allow during the remainder of this season.
- Hard Contact %: This sabermetric breaks down the amount of “hard hit” balls in play. A pitcher with a high hard contact % reflects them allowing line drives and homeruns on a consistent basis which won’t correlate to success over the course of the season. Percentages below .25 are very good with percentages below .15 considered exceptional.
- GB%: This measures the total number of ground balls versus all batted balls put in play. For pitchers that don’t throw hard and rely on command and downward two-seam fastball movement, this can be a good indicator on how successful that pitcher is in executing their game plan. Ground ball pitchers have a percentage above 50% with the league average at 44%.
- BABIP aka Batting Average With Balls In Play: This is another sabermetric that should never be used independently but helps determine how lucky or unlucky a pitcher is against balls in play converting to hits. Here’s an example. A pitcher has a low hard contact percentage at 20% and good strikeout rate at 10 K/9 but a very high BABIP at .350. Over the remainder of the season, the BABIP will stabilize which will result in a better ERA and overall performance . At the end of a season almost all pitchers fit into the league average within .290 to .310.
Matt Harvey: A-
April: K/9 = 10.46 / K to BB Ratio = 10.33 / HR/FB = 12.0% / ERA = 3.04 / FIP = 2.81
May: K/9 = 9.00 / K to BB Ratio = 5.00 / HR/FB = 10.3% / ERA = 3.15 / FIP = 3.09
June: K/9 = 6.89 / K to BB Ratio =4.16 / HR/FB = 12.8% / ERA = 3.03 / FIP = 4.11
Statistical
Harvey allowed 12 homeruns through his first 15 starts this season . That is nearly double the seven homeruns he allowed in 26 games during his 2013 campaign. The positive takeaway is Harvey’s HR/FB rate at 11.7% which is above the league average of 10% and substantially higher than his career HR/FB rate of 7.9%. Concerning, is the steady decline in Harvey’s strikeout rate which can be attributed to his inconsistency in overall command or “feel” in his pitches.
Non-Statistical
I felt I had just watched the future 2015 Cy Young Award winner after watching Matt Harvey’s first start of the season against the Washington Nationals. Harvey commanded all four of his pitches within the strike zone and consistently threw 98 mph with his fastball. As the season progressed, Harvey’s command varied as expected after his past year and a half hiatus to recover from Tommy John Surgery. Harvey’s decreasing K to BB ratio exhibits his inconsistency in command. Harvey will gradually regain the natural feel in his pitches as he continues to throw more innings which will translate to better command.
Second Half Outlook
Harvey’s inconsistency in command helped him develop different approaches in his game plans to get opposing hitters out. The most successful game plan is known as pitching backwards as written in my June 17th article on Matt Harvey. Simply, the art of pitching backwards is the ability to throw off-speed pitches early in an at-bat to set up fastballs later in the at-bat to create outs as opposed to the more traditional first pitch fastball to set up off-speed pitches later in the at-bat. This keeps opposing hitters off balance resulting in less aggressive swings and more pitches taken for strikes.
Assuming that Harvey’s HR/FB rate regresses towards his career and league averages, Harvey will have a stronger second half as he continues to regain his command coupled with his improving pitching acumen.
Jacob deGrom: A
April: K/9 = 6.98 / K to BB Ratio = 3.28 / BABIP = .304 / ERA = 3.34 / FIP = 4.02
May: K/9 = 10.80 / K to BB Ratio = 6.66 / BABIP = .269 / ERA = 2.16 / FIP = 2.21
June: K/9 = 8.92 / K to BB Ratio = 7.40 / BABIP = .204 / ERA = 1.21 / FIP = 1.88
Statistical
The consistent growth in the K to BB ratio is proof of deGrom’s continued advancement in pitch command which directly correlates to lower ERA. The very low .204 BABIP with a higher 1.88 FIP than 1.21 ERA in June does forecast that deGrom may regress a bit but given his overall development in command, it won’t be a noticeable regression.
Non-Statistical
The catalyst to deGrom’s MLB success is the development of excellent fastball command low in the strike zone and improved average and maximum velocity on his fastball. In 2014, deGrom’s fastball averaged 93.5 mph. This season, deGrom’s fastball average is up to 94.7 mph. This jump in fastball velocity allows deGrom to get away with more mistakes within the strike zone than last season. The result is less hard hit balls translating to better overall success.
DeGrom receives the higher grade over Harvey due to better overall performance, consistent improvement and exceeding preseason expectations.
Second Half Outlook
Pitchers that throw their fastball greater than 60% of their pitches, with high velocity and command low in the strike zone, exhibit the most consistent success over long periods of time. This is due to the fact that the fastball is the most relied upon pitch in the MLB, accounting for between 50% and 80% of all pitches thrown for almost all MLB pitchers. Expect that deGrom’s strong statistics from the month of May will be in line with his second half performance.
Noah Syndergaard: B+
May: K/9 = 8.03 / K to BB Ratio = 4.40 / BABIP = .278 / ERA = 1.82 / FIP = 2.58
June: K/9 = 9.96 / K to BB Ratio = 6.20 / BABIP = .375 / ERA = 5.14 / FIP = 2.93
Statistical
Syndergaard quickly established to Mets fans that he is a strikeout pitcher (see K/9 rate), attacking hitters with a 97 mph fastball and a sharp 12 to 7 curveball. Additionally, if we exclude Noah’s four walks in his first MLB start, his K to BB ratio for the first half of the season is an excellent 8.83.
Non-Statistical
Syndergaard’s success keeping the ball down in the strike zone is the trait that keeps him competitive in every game . It’s very difficult for an opposing hitter to lift a 97 mph fastball at their knees for a homerun even if that pitch misses over the middle of the strike zone. Additionally, Syndergaard’s sharp two-seam movement in his fastball is rarely seen with pitchers that throw at higher velocities of 97 mph.
Syndergaard’s 12 to 7 curveball is an established strikeout pitch. At 75 mph, his curveball is almost 20 mph slower than his 97 mph fastball, making it very difficult for hitters to adjust to the speed differential.
There is grade “A” potential in Syndergaard but right now he is still a step behind Harvey and deGrom.
Second Half Outlook
Syndergaard will continue to develop into a MLB ace, assuming both the low 7.8 HR/FB percentage and high .329 BABIP numbers regress towards the league averages.
Syndergaard needs to command a third pitch within the strike zone to become a MLB ace, whether it be his slider or changeup. Although this will likely take place next season, he will produce ace like performances in the second half in games when his third pitch comes naturally to him.
Jon Niese: B-
April: K/9 = 5.48 / K to BB Ratio = 1.55 / Hard Contact % = 34.5% / ERA = 2.74 / FIP = 4.89
May: K/9 = 6.09 / K to BB Ratio = 2.87 / Hard Contact % = 33.6% / ERA = 5.56 / FIP = 4.55
June: K/9 = 7.09 / K to BB Ratio = 1.85 / Hard Contact % = 22.7% / ERA = 3.00 / FIP = 3.66
Statistical
The apparent takeaway from the breakdown above is that Niese shows improvement in every category except K to BB ratio which is down compared to his 2.58 career ratio. During June, Niese finally kept the hard contact percentage down and began to get his strikeout rate up. This resulted in a significant drop in his ERA from May to June.
Also note that his ground ball percentage during these first three months was well above average at 53.4%. Conversely, his HR/FB percentage was 14.3% which is much higher than the league average of 10%
Non-Statistical
Much like deGrom and Syndergaard, Niese has been more successful in recent outings by consistently keeping the ball low in the strike zone. However, the biggest difference is in utilizing his cutter at a higher rate of 27.6% of pitches in June compared with only 17.3% during the first two months of the season. Niese uses his cutter on the inside corner to right handed hitters in an effort to jam them (create low contact %). This keeps hitters from leaning over the plate and making harder contact on his fastball and changeup which Niese tends to throw on the outside corner to righties.
Second Half Outlook
Expect June’s performance to be in line with Niese’s success in the second half based on his overall successful career, current high ground ball rate and the assumption that his HR/FB will regress towards the league average. Most Mets fans would agree with my hope that he continues to build trade value by showing his ability to be a strong third to fifth man in most rotations so the Mets can capitalize by trading him to acquire a hitter.
Bartolo Colon: B
April: K/9 = 6.89 / K to BB Ratio = 25.00 / GB% = 40.4% / ERA = 3.31 / FIP = 3.26
May: K/9 = 7.25 / K to BB Ratio = 7.25 / GB% = 36.4% / ERA = 6.00 / FIP = 4.36
June: K/9 = 6.56 / K to BB Ratio = 3.40 / GB% = 46.9% / ERA = 5.40 / FIP = 4.07
Statistical
Colon’s numbers have been very erratic. In April, Colon walked only one hitter resulting in the extremely high K to BB ratio of 25 but his 3.31 ERA, 3.26 FIP and .273 BABP were average for someone with such a high K to BB ratio. During May, Colon’s ground ball rate dropped 4% from April which resulted in the higher BABIP of .314 and an ERA nearly double at 6.00. By June, Colon’s K to BB ratio had come down towards the league average, his ground ball rate was much better but his BABIP was very unlucky at .342.
Conclusion: Colon cannot be successful with a low ground ball rate (month of May) and a poor K to BB ratio (month of June).
Non-Statistical
There’s not too much to say. Colon is 42 years old. He throws 85% fastballs with varying levels of command. He uses his 19 seasons of MLB experience to compete every time he goes to the mound. He is what he is.
Second Half Outlook
Considering the fluctuating statistics, Colon is an average middle to backend rotation starter. Keeping his walks down and pitches low in the zone, Colon can go 4-1 in April. Unfortunately, he doesn’t have the natural repertoire of pitches at age 42 to overcome the bad luck in a high BABIP as seen in June.
Expect a similar second half around a .500 win percentage with an ERA in the low to mid 4’s.
Follow Chris Zaccherio on Twitter @ziography for more Mets pitching insight that goes beyond statistics.


