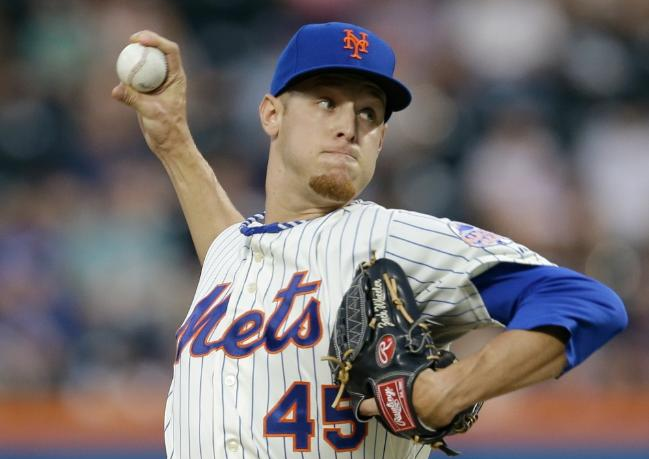
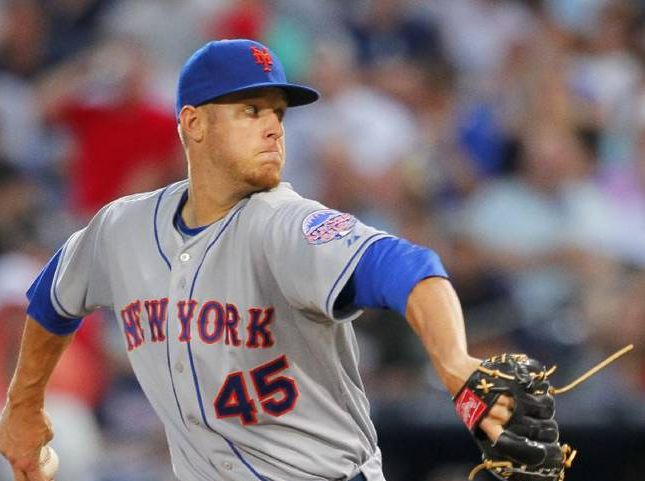
Even if it´s tough to believe for Mets fans, the reason for rather modest projections for 2014 is the lack of trust that analysts have in the – mostly unproven – Mets pitching staff.
The Fangraphs ZiPS projection is a good indicator for that. The entire projected opening day pitching staff (i.e. rotation of Niese – Colon – Wheeler – Gee – Mejia) projects to combine for a mere total of an 8 fWAR. Which is by far the worst projected pitching staff in the divisision, well behind the Marlins & Phillies (both 13 fWAR), Braves (20 fWAR) and Nationals (21 fWAR).
 Meanwhile, the Mets´ projected offense is a lot closer towards contender status at a combined 19 fWAR, well ahead of the Marlins (12 fWAR) and Phillies (15 fWAR) and barely behind the Braves (20 fWAR) and Nationals (23 fWAR).
And if you look back into the rear view mirror (something all projection systems heavily rely on), the Mets offense averaged 634.5 runs between 2012 & 2013 – with very similar rosters except for Marlon Byrd replacing Scott Hairston and the C position being in flux and CF traditionally unsettled. The Phillies averaged 647 runs (in a hitter friendlier park), the Marlins averaged a terrible 561 runs, the Nationals 693.5 and the Braves 694. So, the Mets were 60 runs away from leading the division in runs scored. Since 1 win takes 10 runs scored or not allowed, the Mets were about 6 wins away on offense from contending for the division crown.
Meanwhile, the pitching was a lot further away at an average of 696.5 runs allowed.
The Nats – on average – allowed 610 runs while the Braves merely allowed 574 runs. So, the Mets were between 86.5 and 122.5 – thus on average 104.5 runs or 10+ wins – off the league lead. Even the Marlins (685 runs allowed) were better and the Phillies – in a much tougher homepark – allowed only 714.5 runs on average – 28 more than the Mets staff´s averaged.
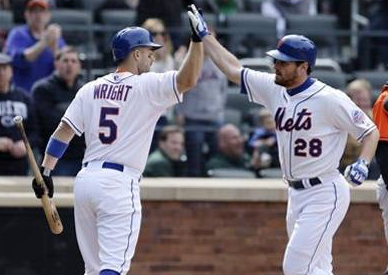
Scott Hairston (2012) & Marlon Byrd (2013) now get replaced by Curtis Granderson while Travis d’Arnaud takes over at catcher for Josh Thole (2012) and John Buck (2013). CF remains unsettled but now features Juan Lagares & Chris Young as the main options instead of the revolving door of 2013 and Kirk Nieuwenhuis & Andres Torres in 2012. The rest of the roster essentially returns, though it appears only one of Duda & Ike Davis will play regularly. All in all, if d´Arnaud is better than Buck & Thole were, while the CF also produce more, expecting the 2014 Mets to score at least 650 runs seems reasonable and thus a gain of 1 or 2 wins as it is, not expecting any breakouts from Ike or Tejada or regression from Wright and Murphy.
 But it all comes down to the pitching. If the Mets staff gives up 695 or more runs again – and thus on average 100 more than the Nats & Braves figure to give up – they won´t make up the difference. If the Mets give up 50 runs less by pitching better, that´s good for 5 wins and a .500 season overall (650 RS vs. 645 RA). If the Mets give up 100 runs less by pitching much better – both in the rotation and bullpen – they would make up another 5+ games and would project to end up right around 86 or 87 wins. And if you happen to like the depth that the Mets will finally have on both their pitching staff (Montero, Syndergaard, young relievers, etc) and offensively (mainly Flores but also some fringy outfielders like Nieuwenhuis & MDD), the upside may even be a little higher compared to the 2012 and 2013 teams that both lacked quality depth behind the regulars.
To summarize, the Mets figure to have a middle of the pack offense in 2014 and going forward. Which isn´t too bad, considering that Citi Field plays about neutral to slightly pitcher friendly. If the pitching remains below average like it has been in 2012 and 2013, the Mets won´t crack .500 and certainly won´t contend. If the young arms perform and the veterans remain solid, this is the big area of upside – both rotation & bullpen – where the Mets could improve significantly.


