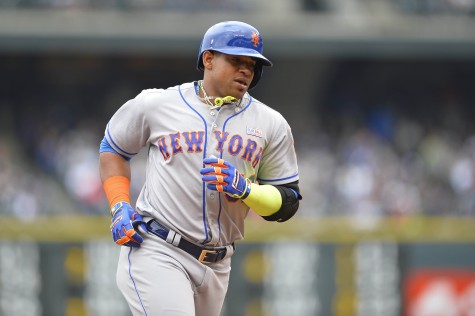
Yoenis Cespedes is the current team leader in wOBA with a .395 mark.
For the next few days, I will be bringing back my “Know Your Stats” series that I began a few years back to highlight some important sabermetric stats and concepts. Earlier today, we went through OPS and OPS+. Now we continue with wOBA…
Perhaps the best way of describing weighted-On Base Average (wOBA) is to describe the faults of some of the traditional hitting statistics first.
Batting average, for all its history, fails on numerous fronts. For one, it values all hits equally, from an infield single to a home run. It also doesn’t include walks, which, however unexciting, undeniably contribute to a team. On-Base Percentage does a little bit better, adding walks to batting average, but again values a walk and a home run as the same. Slugging percentage attempts to weigh certain hits as more valuable than others, but fails to include walks and doesn’t weigh hits properly. A triple, for example, is not worth three times as much to a team compared to a single. We know this because of linear weights, which show that a triple does not create a run expectancy three times greater than one created by a single. Before we get to wOBA, it’s important to understand one very important thing about linear weights, which will clear up the somewhat confusing formula. Take a look at this excerpt from Fangraphs’ library:
There is nothing arbitrary in the exact weighting we have of a home run relative to a triple, or a ground ball to a line drive. Years upon years of data allow us to convert back and forth, or up and down with ease. A common complaint with modern sabremetrics is the bewildering array of fractional coefficients that dot the scene, but if you look at a formula that’s based on linear weight, don’t see them as confusing numbers. Instead, look at them as relative values, derived through years of baseball being played.
Essentially, the coefficients in wOBA come from the decades of baseball history that show us how singles, doubles, triples, home runs, walks, and HBP affect a team’s run expectancy. When you look at the wOBA coefficients, they intuitively make sense before you even look at what the linear weights tell you. A walk is worth slightly less than a single because a single moves runners over two bases more often. Just as eras change, wOBA can slightly change from year to year, although nothing really changes that significantly. You can see the constants going back to 1871 here. Here is the current wOBA formula:
wOBA = (0.688×uBB + 0.719×HBP + 0.878×1B + 1.245×2B + 1.576×3B + 2.030×HR) / (AB + BB – IBB + SF + HBP)
More Thoughts
- wOBA is a context-independent statistic meaning a walk with the bases loaded and a walk with the bases empty are weighted the same, just like most traditional statistics we deal with.
- wOBA and its park-adjusted, indexed counterpart wRC+ are the gold standard for publicly-available offensive statistics.
In Context


