My colleague, Connor O’Brien, did a series of getting to know your sabermetrics statistics in 2016. I wanted to continue his efforts to bring more stats to you that many baseball front offices believe are important in player evaluation. I have previously covered ERA+ and xwOBA in my portion of the series.
No one knows how to perfectly predict defense, largely because it really can be so unpredictable. With that said, there are statistics to use and not to use when looking at defense.
The ones we absolutely should not use are fielding percentage or errors. I detailed why in an article back in July.
Here’s an excerpt I have from it to give you an idea:
“Platinum glover Andrelton Simmons had 14 errors in 2013. Simmons had 41 DRS that year. Reyes would have had roughly seven errors if he played 145 games at shortstop, but also -17 DRS. Simmons’ 2013 fielding percentage that year was .981, lower than Reyes this year. Despite seven more errors than what Reyes would post in a 145-game pace and a lower fielding percentage, he still graded out as the much better defender.”
Defensive Runs Saved is arguably the best measurement of defense we have currently. I’ll use Fangraphs explanation as it is more straightforward than Baseball Reference, though both are very similar and when discussing DRS, it is okay to use either site’s numbers.
To put it simply, Defensive Runs Saved is a combination of many defensive statistics like rGDP which is runs saved by turning a double play. The other statistics include rARM (runs saved by your arm), rGFP (runs saved by good fielding plays), and rPM (plus or minus runs saved).
Runs plus or minus saved requires some math as explained by Fielding Bible. I’ll try and provide an example to help understand how it works but I highly recommend you to read Fielding Bible’s explanation. They are definitely far more eloquent in their explanation than I am.
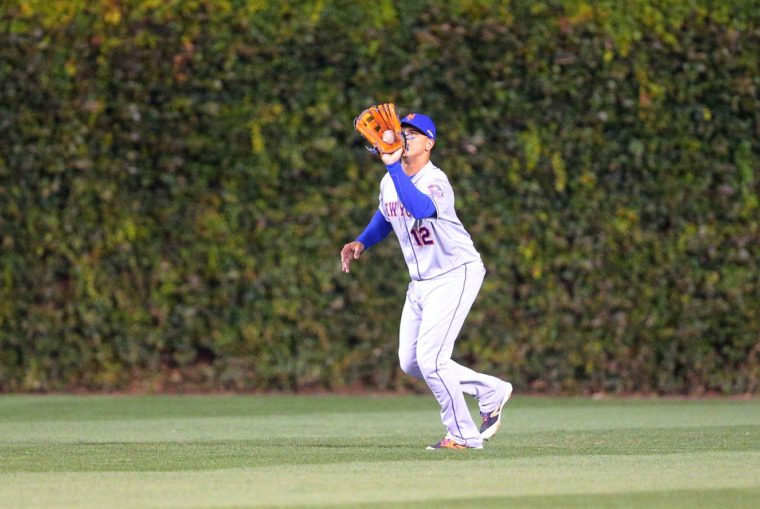
Let’s say Juan Lagares makes a play that is what we are used to seeing from him. Say other center fielders make said play 22 percent of the time. That would mean 78 percent of center fielders don’t make that play. Let’s say this play, when not made, results in the hitter getting two bases (a double). Lagares would get a basic rating of +1.56 (.78 multiplied by the average number of bases the hitter gets, which is two) on this play.
What if he doesn’t make this play? Well, since only 22 percent of center fielders make this play, we multiply -0.22 by the number of bases the hitter gets out of the play.
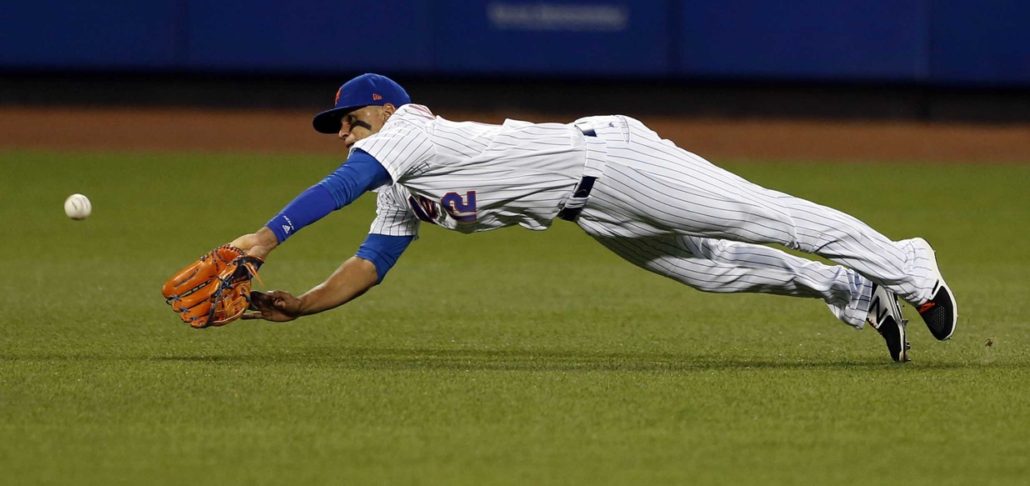
For example, if Lagares tried making the play but pulled a Nyjer Morgan and threw his glove to the ground and allowed an inside the park home run, he’d be charged with a basic rating of -0.88. When calculating plus ratings, we multiply the percentage of the play not being made with the average number of bases the hitter would get when that play is not made. When calculating minus ratings, we multiply the percentage of the play being made with the number of bases the player got on that play.
We’re not quite done yet though. Each position has a position factor. Center field’s is 0.56, so we will multiply that number we got for the basic plus or minus by 0.56. So his plus would be 1.56*0.56, which is 0.8736. His minus would be -0.88 (in the event he allowed an inside the park homer under his watch) multiplied by 0.56, which is -0.4928. Again, the Fielding Bible article I linked to above is a great resource to use when talking about this subject.
So there you have it, Defensive runs saved is a statistic made up of other statistics. Every position varies on what is used to measure the total defensive runs saved. For example, runs saved by good fielding plays and plus or minus runs saved matter more than runs saved by arm if you’re a first baseman.
Shortstops and second basemen have more runs saved by turning the double play and plus or minus runs saved. Outfield usually has runs saved from your arm, runs saved from good fielding plays and plus or minus runs saved.
DRS is still a new statistic and is still improving. It has its flaws but it provides value that fielding percentage just does not. In my opinion, the future of defense will likely trend towards Statcast. They have started developing stuff like route efficiency, catch probability, outs above average, and catch rating which is just the beginning. While it’s currently just for outfielders, I believe it will start involving more positions to give us more numbers to judge players.
![]()


