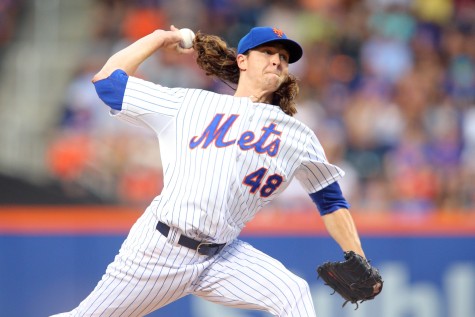
Jacob deGrom starts his 23rd game of the season tonight against the Baltimore Orioles. Currently, deGrom’s 22 starts this seasons matches his 2014 total. No better time to compare the two seasons. Here are five statistical categories deGrom has shown improvement and the impact it’s had in his overall success this season.
Strikeout to Walk Ratio (K to BB Ratio)
This ratio indicates the strength of a pitcher’s ball movement coupled with the pitchers command of their ball movement within the strike zone. Higher ratios correlate to strong command of the baseball on both side of the strike zone while inducing swings and misses both in and out of the strike zone.
DeGrom’s strikeouts per nine innings (K/9 rate) are similar at 9.33 K/9 this season compared with 9.24 K/9 in 2014, far superior to the league average of 6.41. However, improvement is seen in his K to BB ratio.
In 2014, deGrom had a mediocre 3.35 K to BB ratio. His 5.43 K to BB ratio this season puts him in the upper echelon in MLB pitching hierarchy.
Average Velocity
Velocity alone doesn’t make deGrom or any pitcher better but it allows him to make more mistakes in the middle of the strike zone without penalty.
Higher velocity is due to the baseball spinning at a higher number of revolutions per second, also referred to as tighter spin on the baseball. Tighter spin directly correlates with sharper, quicker pitch movement. All of which produce a higher swing and miss rate (miss/whiff rate) or simply, pitches more difficult to make strong contact with.
In 2014, deGrom’s fastball averaged a respectable 93.5 mph with max velocity at 97.3. This season he has shown a 94.9 mph average fastball, maxing out at 98.8 mph. Additionally, his slider averages 89.7 mph as opposed to 87.0 mph last season.
Hard Contact % and Line Drive %
Less hard contact equals less extra base hits equals less earned runs allowed.
In 2014, deGrom had a 31.8% hard contact rate versus 26.6% this season. Consequently, his line drive rate is down to 20.3% from 23.2% last season.
Miss/Whiff Rate
The best MLB pitchers consistently induce swing and misses with their fastball. Excluding knuckle ball pitchers, all MLB pitchers throw their fastball more than any pitch in their repertoire thus the importance of producing a high miss rate with the fastball.
DeGrom’s improved velocity and command of his fastball has translated to an 11.84% miss rate with his fastball this season, a whole percentage higher than the 10.82% miss rate in 2014.
Earned Run Average
Although deGrom’s FIP is basically identical year over year (2.67 in 2014 vs, 2.62 in 2015), his ERA is substantially lower at 2.03 this season compared to 2.69 in 2014.
Pessimists of deGrom would contend his ERA is due to regress towards his FIP. Normally this is true as ERA and FIP were created with the intention to correlate with one another. One component that FIP doesn’t consider is hard contact for balls put into play, which as seen above, is exponentially better for deGrom in 2015.
DeGrom’s improved velocity and command creating weaker contact and higher miss rates this season as compared to last will result in a strong finish to his 2015 campaign.
Thanks to @FanGraphs and @BrooksBaseball for statistics.
Follow Chris Zaccherio on Twitter @ziography for more Mets pitching insight that goes beyond statistics.


