This is what happens when you’re fresh off a historically dominant season.
New York Mets ace Jacob deGrom won the 2018 National League Cy Young award despite a 10-9 record because of an incredible 1.70 ERA, 2.78 SIERA, 32.2% strikeout rate, and 5.5% walk rate. This performance included 217 innings, a 9.0 fWAR, an All-Star nomination, a fifth-place finish in NL MVP voting, and 24 consecutive quality starts to finish the year. No matter how good he would be moving forward, expecting the same or better production from the right-hander wouldn’t have been fair.
He hasn’t been as dominant to start 2019. From looking at his overall statistics, though, he hasn’t been bad at all. Through 63 innings, he owns a 3.71 ERA, 3.50 SIERA, 29.0% strikeout rate, 6.8% walk rate, and 1.4 fWAR. But after a year in which he was dominant every time he took the mound, he’s had to deal with more peaks and valleys than he has in quite some time.
Some negative regression from last season was likely expected, and a number of his peripherals don’t look drastically different from 2018. However, there are a few areas that need to normalize.
Changes in His Batted-Ball Profile
When looking at deGrom’s batted-ball profile, there have been some slight changes going on that are worth noting. What’s more drastic at this particular time, though, is the change in the quality of contact he’s allowed. Here’s a quick look at how his line-drive rate (LD%), ground-ball rate (GB%), fly-ball rate (FB%), infield-fly rate (IFFB%), soft-hit rate (Soft%), and hard-hit rate (Hard%) have changed since the start of 2017.
| Year | LD% | GB% | FB% | IFFB% | Soft% | Hard% |
|---|---|---|---|---|---|---|
| 2017 | 21.1% | 45.3% | 33.7% | 9.8% | 21.3% | 31.9% |
| 2018 | 21.9% | 46.4% | 31.6% | 16.3% | 25.2% | 26.6% |
| 2019 | 22.6% | 43.3% | 34.1% | 12.5% | 20.2% | 38.1% |
The rate at which deGrom is allowing each batted-ball event isn’t much different from the last couple years, but there’s definitely some slight regression across the board. That wouldn’t be as big of a deal if his quality-of-contact numbers were more in line with what he’s done recently, but they’re definitely not.
This is mostly due to a rough month of April, as the right-hander has seen his numbers come back down to reality throughout May. Here’s a look at how these numbers differ from one another if we split it out by month.
| 2019 | LD% | GB% | FB% | IFFB% | Soft% | Hard% |
|---|---|---|---|---|---|---|
| March/April | 28.6% | 28.6% | 42.9% | 16.7% | 20.3% | 47.5% |
| May | 19.4% | 50.9% | 29.6% | 9.4% | 20.2% | 33.0% |
Despite the struggles with inconsistency (especially compared to 2018), this is certainly an encouraging sight. The quality-of-contact numbers will be important moving forward, as they were a big part of deGrom’s success last season (he led qualified starters in soft-hit rate allowed and was among the top five in hard-hit rate allowed).
Slight Shifts in Pitch Mix…
One of the most notable aspects of deGrom’s historic 2018 was that he threw fastballs at a career-low rate. And it wasn’t just last year — this has been part of a trend that’s been going on for a number of years. But so far in 2019, his fastball usage has increased, while some of his secondary pitches have also gone through changes.
| Year | FB% | SL% | CB% | CH% |
|---|---|---|---|---|
| 2017 | 55.4% | 22.7% | 9.5% | 12.4% |
| 2018 | 52.1% | 23.9% | 7.9% | 16.1% |
| 2019 | 57.0% | 24.4% | 4.7% | 13.8% |
In addition to this rise in fastball usage, it’s involved not many sinkers, according to FanGraphs. Last season, deGrom threw his four-seamer more than 1,300 times, but did mix in his sinker a smidge over 300 times. That’s completely changed this year, as the right-hander has used his four-seamer 579 times and his sinker just three times.
If we continue using this 2017-19 time frame, each of his pitches are tracking to increase in average velocity for the second consecutive year. In fact, deGrom’s average velocity for each of his four pitches are among the top-10 in baseball when looking at qualified starters.
…And The Performance of Those Pitches
The problem here isn’t necessarily the usage of deGrom’s pitches, but the performance.
His slider usage was the only one that has basically stayed the same, but the pitch’s value has changed quite a bit. If we use FanGraphs’ pitch value numbers on a per-100-pitch basis, deGrom’s 2.08 slider value was among the best in baseball last year. So far in 2019, that value is all the way down at -0.15. Outside of his rookie campaign, the right-hander has never finished with a slider value below 1.00.
This offering has still held opposing hitters to a .605 OPS, 68 wRC+, and 26.9% strikeout rate, but those are all substantial differences to what the pitch produced in 2018 (.465, 36, 35.7%, respectively).
Another fascinating part of deGrom’s Cy Young campaign was that all his pitches dominated. Opposing hitters failed to post a wRC+ greater than 100 for any, with just two getting above 80. This year, three of his four offerings have led to an opponent wRC+ above 80, including a 119 mark against his changeup. While deGrom’s strikeout rate with this pitch is up at 36.1% (29.1% in ’18), hitters are still slashing .314/.333/.457 against it.
The 30-year-old’s 2.48 changeup value per 100 pitches was the best in baseball last year. That number is currently down at -0.49.
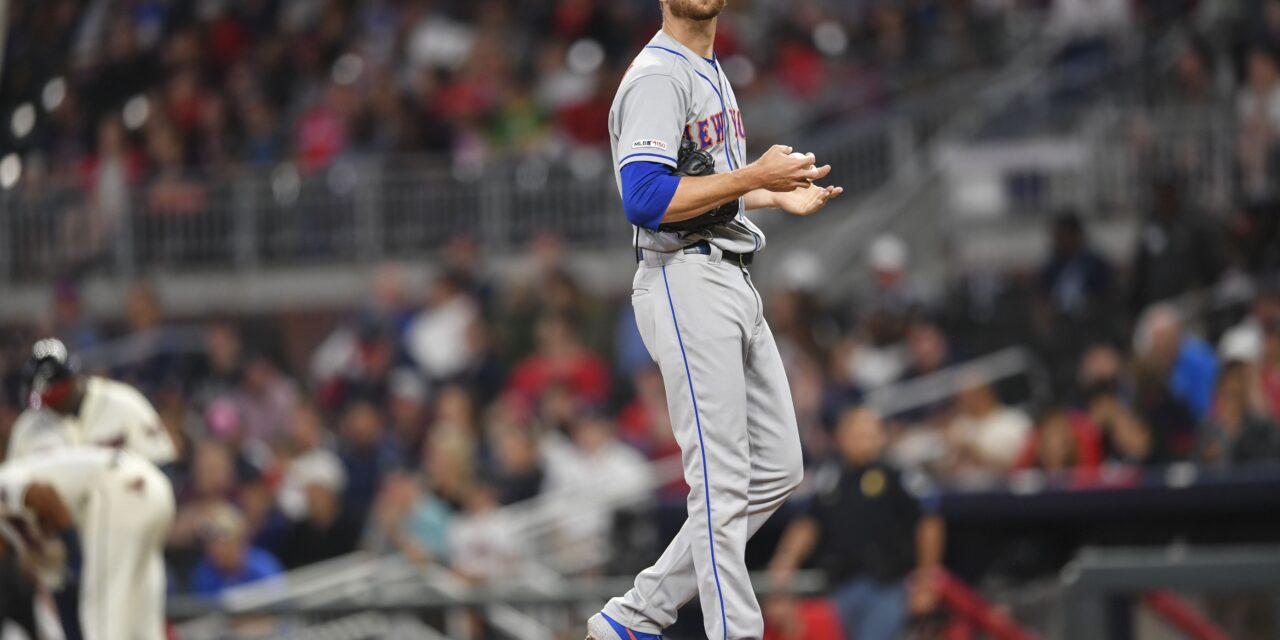
Is deGrom going to be just fine? Well, of course he is. He’s still able to provide solid outings for New York when he doesn’t have his best stuff, like on Monday night against the Los Angeles Dodgers. Expecting him to post another sub-2.00 ERA this year is unrealistic, but he’s already on the road toward getting back to his consistent self.
After a full calendar year of him dominating everyone, it’s just weird to see him dealing with some inconsistency. This definitely has him frustrated, but hopefully a mad deGrom will keep sending him in the right direction.


