

Credit: Andy Marlin-USA TODAY Sports
Noah Syndergaard is no longer with the New York Mets, but he sent out a pretty simple tweet years ago that still gets referenced quite a bit. And, truth be told, I think about it at least once a year.
We are a 2nd half team
— Noah Syndergaard (@Noahsyndergaard) July 10, 2016
On the day he tweeted this, the Mets were 47-41 and six games behind the Washington Nationals in the National League East. Of course, New York sunk a little deeper and looked dead in the water a little over a month later — they were 60-62 on August 19th — before finishing 87-75 and clinching a wild-card spot.
Just as I’ve talked about how having a strong April has been important for the most recent successful Mets teams, it also feels like the second half has been a defining portion of the season. Let’s use the 2019 and 2021 squads as examples. The 2019 club struggled to a 40-50 record heading into the All-Star break, and while they didn’t reach the playoffs, they were in the conversation thanks to a 46-26 showing in the second half. It was the opposite this past season — after going 48-40 in the first half, they spiraled out of contention thanks to a 29-45 second-half performance.
So, this got me thinking as I continue attempting to distract myself from spring training getting delayed this year. How often have winning Mets teams encountered a better second half of play?
Looking at the Data
The below tables show all of the Mets’ winning seasons in franchise history, along with that club’s first-half record, second-half record, and the corresponding winning percentages. There are 26 different winning seasons to look at, so the first table is all the winning seasons from 1997 to the present day:
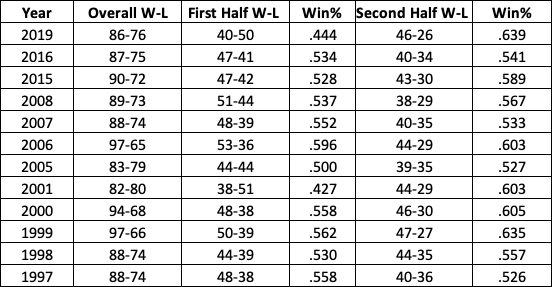
Obviously, this comes with a couple of caveats for at least two of the years. It doesn’t look like the 2016 squad did that much better in the second half, but they got white-hot over the final six weeks of the season. As mentioned before, they were 60-62 on August 19th, meaning New York posted a 27-13 record over its final 39 games to clinch a playoff spot.
And although I don’t want to mention it, can you imagine how much better the Mets’ second-half record would’ve been in 2007 if they didn’t lose 12 of their final 17 games? Sigh.
Moving on to the next portion of this sample, the below table includes all the winning seasons between 1962 and 1996:
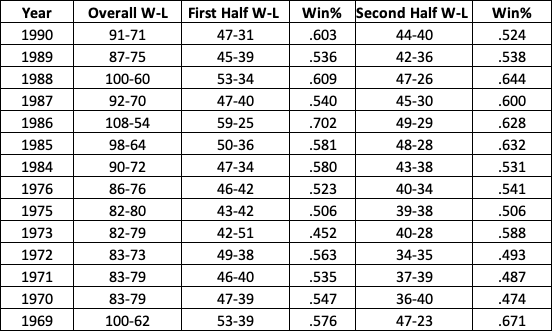
It’s pretty crazy how much 1969 sticks out through the organization’s younger years. Obviously, after seven straight losing seasons, a 100-win campaign is going to stick out like a sore thumb. But after that, the Mets got themselves above the 83-win plateau just once in 15 years.
This also shines a light on how much fun it was to be a Mets fan in the 1980s. Sure, it only included two trips to the postseason, but seven straight winning campaigns? Six seasons of at least 90 wins? New York has won at least 100 games in a season three times in its 60-year history, and it happened twice between 1986 and 1988.
Digging into the Details
Of course, we’re here to compare first-half and second-half performances. One thing we can establish right off the bat (pun intended) is if the Mets have a winning season, it typically means they post a winning record in both halves.
There were just three times in the above sample where the Mets posted a losing record heading into the All-Star break: 1973, 2001, and 2019. On the flip side, they’ve also posted a losing record after the All-Star break just three times, and it hasn’t happened in 50 years. The three occurrences did happen in consecutive years from 1970 to 1972.
But then there’s the big question we’re trying to answer here — are winning Mets squads typically a second-half team, as Syndergaard proclaimed in 2016? Out of the 26 above occurrences, New York has posted a higher winning percentage in the second half 17 times, which susses out to just over 65% of the time. It’s even more frequent when looking at the last 12 winning teams — it’s happened on 10 occasions, which is just over 83% of the time.
Which Ones Were Most Significant?
As it turns out, Syndergaard was right, and more than he likely originally thought. When the Mets are good, they do generally seem to kick it up a notch following the All-Star break. If we look at the difference in winning percentage between both halves, the top-five most significant second-half tears happened in 2019 (+.195), 2001 (+.176), 1973 (.136), 1969 (+.095), and 1999 (.073).
The 2019 and 2001 seasons both seemed to follow a similar pattern. In each instance, they dug themselves into too deep of a hole in the first half, and while they played better than .600 ball to finish the year, it was too little, too late. The 1973 and 1969 seasons share a similarity in that they each appeared in a World Series, but they got there in very different ways. The ’73 club needed a second-half push just to squeak into the playoffs in the first place. The ’69 club needed to at least keep its first-half pace, but they found another gear to win the division by eight games over the Chicago Cubs. As for 1999, they were just good all year. Man, that was such a fun team.
Does this mean anything for the 2022 Mets once they actually get to play? Eh, probably not much, but having a second-half surge heading into October is never a bad thing. Based on recent history, if New York is going to enjoy a winning campaign, it wouldn’t be outrageous to expect at least slightly better performance once they return from a midsummer break, though.


