The 2018 season didn’t go as planned for the New York Mets overall, but one part of the roster that performed very well — especially down the stretch in September — was the starting rotation.
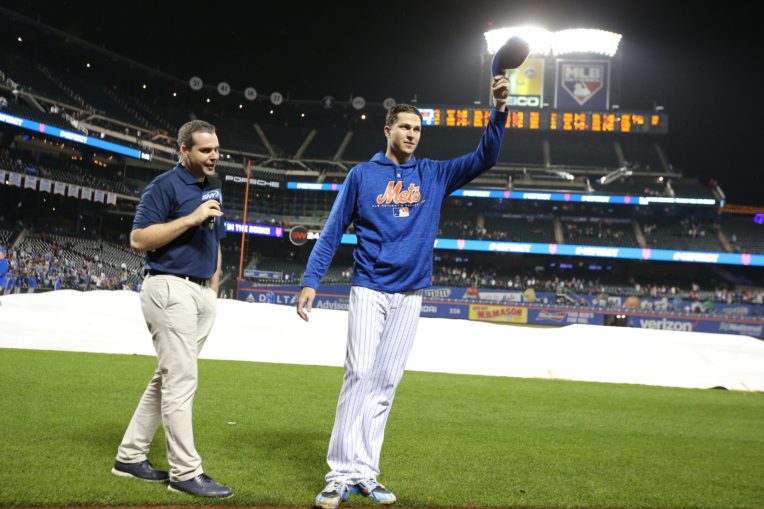
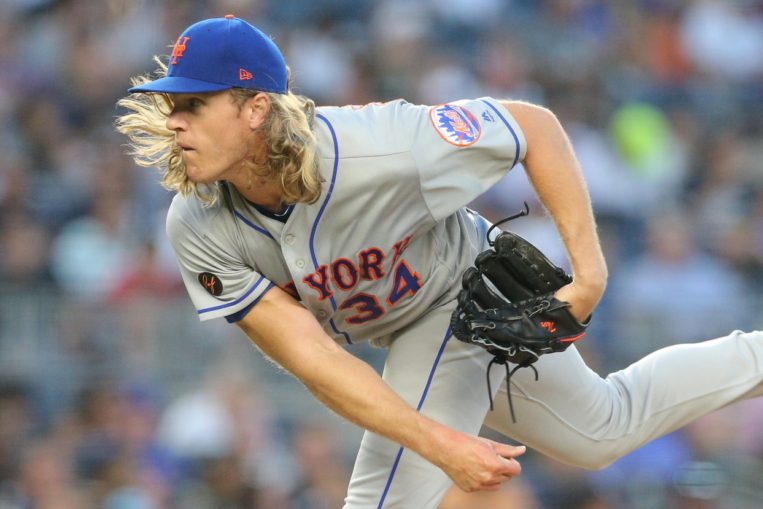
This group not only bounced back after a rough 2017 campaign, but they also were among the more valuable ones in baseball when looking at fWAR. As we’ve mentioned in the past, the performances of Jacob deGrom, Noah Syndergaard, and Zack Wheeler basically carried the rotation to where it finished up by season’s end.
One of the things these three each dominated was the quality of contact department. When looking at starters with at least 150 innings of work last year, they ranked second (Syndergaard), third (deGrom), and sixth (Wheeler) in soft-hit rate allowed, while also having the lowest (Syndergaard), second-lowest (Wheeler), and fifth-lowest (deGrom) hard-hit rate allowed.
Despite them doing most of the heavy lifting in these respective departments, the Mets as a rotation actually finished with the highest soft-hit rate allowed (21.5%) and lowest hard-hit rate allowed (29.0%) in 2018. When seeing the league averages for these numbers settle in at 17.5% and 35.6%, respectively, it makes what they accomplished all the more impressive.
So how exactly did the rotation accomplish this feat? Throwing inside with more regularity thanks to the presence of pitching coach Dave Eiland certainly helped, but there has been a clear shift in pitch mix going on over the years: the Mets, as a unit, are relying less and less on fastballs.
New York’s rotation threw fastballs at a 56.6% clip in 2018, which is still above the league average of 53.5%, but it’s been on a noticeable decline for three years now. Here’s a look at how the Mets’ rotation has used four specific pitches since 2015.
| Year | Fastball | Slider | Curveball | Changeup |
|---|---|---|---|---|
| 2015 | 62.8% | 9.6% | 11.7% | 12.2% |
| 2016 | 65.1% | 15.8% | 9.0% | 9.9% |
| 2017 | 57.3% | 18.7% | 10.9% | 12.4% |
| 2018 | 56.6% | 15.1% | 12.1% | 14.7% |
While slider usage has been somewhat constant since 2016, usage of curveballs and changeups have been on a steady rise, along with fastball usage heading in the opposite direction. It also doesn’t hurt that the team’s average fastball velocity within the rotation was 94 miles per hour in 2018, easily the hardest of this particular time frame we’re looking at.
When keeping in the theme of using the Mets’ big three starters (at least for now barring any trades) as an example, it’s interesting to see that they each fit a similar mold.
DeGrom’s velocity was up across the board during his Cy Young campaign, but even though his average fastball velocity was a career-high 96 miles per hour, he threw the ol’ number one at just a 52.1% clip, a career-low mark and the third consecutive year that number has dropped. The right-hander paired that with career-high usage rates for his slider (23.9%) and changeup (16.1%).
It’s a little harder to compare Syndergaard’s 2018 performance to the year prior since he accumulated just 30.1 innings of work, but this pattern sticks when looking at his stellar 2016 season. The usage of his fastball shrunk down to career-low rates (59.1% in ’16 to 53.6% in ’18), while his changeup rate soared to career-high marks (11.2% in ’16 to 15.7% in ’18).
Wheeler doesn’t use his changeup nearly as much as his fellow two rotation mates, as he’s more of a fastball-slider-curveball kind of hurler. But still, his reliance on the fastball has steadily decreased since debuting in 2013.
| Year | Fastball | Slider | Curveball |
|---|---|---|---|
| 2013 | 71.1% | 15.7% | 10.0% |
| 2014 | 62.1% | 15.0% | 15.8% |
| 2017 | 61.8% | 20.2% | 13.5% |
| 2018 | 58.2% | 19.2% | 10.5% |
The 28-year-old paired this lower reliance on his fastball with an average velocity of 95.5 mph, which is the hardest he’s ever thrown in the big leagues.
Obviously, how pitches are used is important, but it’s just as important — if not more so — to see how effective they actually are. When using FanGraphs’ pitch value metric on a per-100-pitch basis, 2018 was the first time in this small sample in which each of the four pitches we’ve been focusing on have finished with a positive value.
| Year | Fastball | Slider | Curveball | Changeup |
|---|---|---|---|---|
| 2015 | 0.60 | 0.21 | -0.02 | 0.10 |
| 2016 | 0.23 | 1.25 | -0.01 | -1.22 |
| 2017 | -0.37 | 0.16 | -1.52 | -0.26 |
| 2018 | 0.32 | 1.44 | 0.20 | 0.28 |
Although the rotation’s 61.6% first-pitch strike rate was the lowest it’s been during this four-year span, that number settled in as a top-10 mark in all of baseball. Still getting ahead of hitters at a healthy clip likely made it easier to rely on fastballs less than in years past. This helped lead to a 32.6% chase rate, which tied with the Los Angeles Dodgers for the league’s sixth-best mark. That number was also the highest it’s been when looking at the rotation performance between 2015 and 2018.
Some may look at the quality of contact numbers for the Mets’ rotation this past year (especially their big three starters) and just assume it was a bit of an outlier, but that’s certainly not the case. These hurlers have been on this track for a number of years, and it appears that Eiland’s presence has helped accelerate the process.


