
The Society for American Baseball Research doesn’t really sponsor particular statistics, but two years ago, it formed a committee to create a newer, better defensive statistic called the SABR Defensive Index. SABR has periodically released updates of this newly-created stat, and you may find the results interesting.
Defensive Index, or SDI combines a number of already established defensive metrics. Individual metrics can be somewhat narrow in their scope and thus the results can vary from one to another. SDI combines two types of defensive metrics, batted ball and game log. 70 percent is made up of batted ball, or zone rating statistics. These stats use what may be considered hit f/x to evaluate defense based on exact locations of batted balls. The other 30 percent is composed of game log statistics. Each have their advantages and disadvantages, so SABR combined them with the hopes of making a more stable metric. Remember how experts say not to rely on UZR over sample sizes of three years or more? That’s pretty absurd and not good for short-term analysis. This new stat may be a step in the right direction in solving that problem, as well as others involving defensive statistics.
For reference, here are the statistics that make up Defensive Index:
Batted ball stats:
- Defensive Runs Saved
- Ultimate Zone Rating
- Runs Effectively Defended
Game log stats:
- Total Zone Rating
- Defensive Regression Analysis
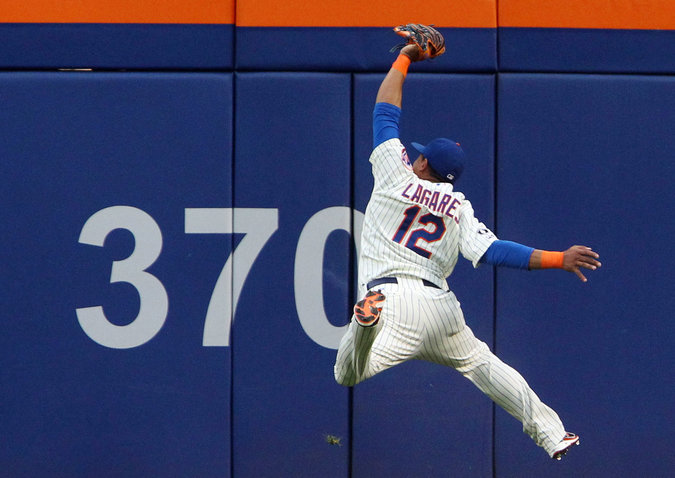
Now to the fun part: the league leaders. In the American League, it is Alex Gordon (it’s pronounced… never mind) with 16.8 runs saved (compared to league average). In the NL, it’s Jason Heyward with 21.3 runs saved. Fourth in the National League and tops among MLB center fielders is Juan Lagares, who has saved 11.5 runs this season. This is extremely impressive considering how few innings Lagares has played compared to some of the other leaders (SDI is a cumulative stat). Billy Hamilton, the closest center fielder to Lagares, had played 828 innings as of August 3 (the stat is as of August 3) compared to Lagares’ 594.2 innings. Given a full season, Lagares would likely be closer to Heyward and Gordon than to Hamilton.
Here is how some other notable Mets have fared as of the latest release:
- Travis d’Arnaud: -6.1 (last in the NL)
- Lucas Duda: +1.5
- Daniel Murphy: -5.9
- Ruben Tejada: +3.6
- David Wright: +5.8
- Curtis Granderson: +0.7
- Chris Young: +3.5
- Eric Young: +3.2
- Dillon Gee: +1.9
- Jacob deGrom: -0.8
- Bartolo Colon: -0.5
This may just be another metric to some of you, but it actually plays a role in the awards process. This metric now takes up one quarter of the votes for the Gold Glove and Platinum Glove awards each winter. Every voter is sent a heaping packet of information with SDI and similar data and the statistic is given a sizable share of the voting as well. Say what you will about the statistic, but at least something is being done to fix the inaccurate, often subjective Gold Glove voting.
If you’re interested in this type of stuff, definitely look into this statistic. The fact that it incorporates the best defensive stats available (as well as one or two original SABR-created stats) will stabilize it from year to year, finally giving some more credibility to advanced defensive metrics. And hey, just about anything is better than fielding percentage.


