An MMO Fan Shot by Greg Jones
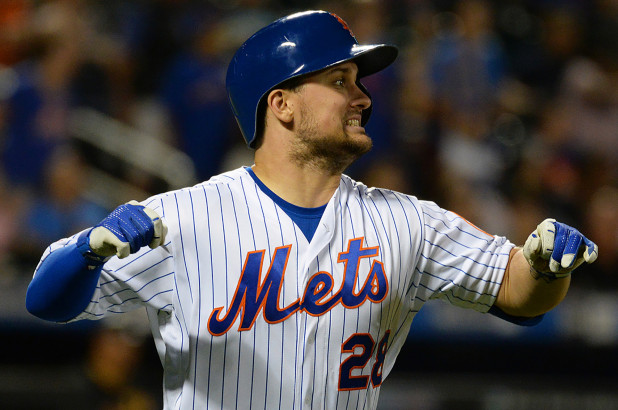
Anyone who clenches and visits the Metsblogosphere on a regular basis knows there is one constant drumbeat – get rid of J.D. Davis. Let’s unpack the J.D. package so in the future I can link to this instead of typing in a defense of J.D.’s value to the Mets. And so can you. I wrote this out as very in-depth analysis of J.D., 7000 words, his college career as a pitcher, his 49-yard field goal in high school, his 2018 Triple-A batting championship, his record-setting 2019 year (with the highest OPS in Citi Field history.) His slashes in his first 162 games with the Mets – the best in Mets history save Piazza and Gilkey 20 years ago.
Basically, I was tackling this narrative:
“J.D. Davis is a good bat, but his glove is killing us at third base. We should trade him for a mid 30-something who will cost 10 times as much.”
I then wrote a long analysis of J.D.’s defense. I started by looking with the traditional defensive metrics like errors and fielding percentage, prepared with some excuses like J.D. being jerked around at four positions plus pitching in his professional career, and half his errors the past two years came in two games in Chicago when he just got off the IL with a hand injury and it was 31 degrees windchill. But, to my surprise, J.D. looks pretty damn good in those traditional metrics anyway, even given all that. Huh?
Let’s start simple. How many plays do you screw up? Fielding percentage is (putouts plus assists) * (putouts plus assists plus errors). Think of it as, if I hit 1000 balls at you, how many plays do you make successfully? Coming into 2021, J.D.’s career fielding percentage was .953, against a league average of .953 over those years. In 2020 he was the fifth best among NL third basemen with 250 innings or more in fielding percentage, trailing three Gold Glovers in Arenado, Machado, and Longoria.
Coming into this year, among the in-house candidates at third, here were the career fielding percentages at third:
Davis: .945
Guillorme: .934
McNeil: .922
Villar: .906
Surprised? How about range, you are about to say. My first glance was to the Godfather, Bill James, and his website, BJOL.com, (which I heartily recommend). Range measurements have been a heated subject over there, and I found that Bill had just last week made this rather sweeping indictment:
“Mr. Range Factor is a very interesting but notoriously unreliable witness.” — Bill James 06/25/21
Without getting over my skis trying to explain this, let’s just say the shift, now about 25% of plays for most teams (25.6% on average in 2019), has crapped all over range calculations. The advanced metrics guys are scrambling with new formulas, but, what the hell, let’s look anyway at RF/9, the most straight forward of them, simply counting the number of plays made per nine innings: (9 * (Putouts + Assists) / Innings Played)
J.D. career RF/9: 2.51 League average: 2.58
Villar: career RF/9: 2.42 League average: 2.58
Guillorme career RF/9: 1.80 League average: 2.59
McNeil: career RF/9: 2.98 League average: 2.59
So, J.D. doesn’t look bad there either. But the challenge in making a case for true relevance here is sample size. I could use any of the advanced metrics here, but let’s use as an example Defensive Runs Saved. Advanced metrics, elevator speech, are black box stuff you can’t figure out yourself like the above calculations. They don’t have two or three factors in their formulas, they have hundreds, many subjective, many evolving as new technologies come into play with cameras and computers, and, to the point here, requiring very large samples. If you go to the introduction on Fangraphs when DRS was first introduced, the inventor of DRS, John Dewan, said this:
“The other thing to remember is that DRS isn’t going to work well in small sample sizes, especially a couple of months or less. Once you get to one and three-year samples, it’s a relatively solid metric but defensive itself is quite variable so you need a good amount of data for the metrics to become particularly useful. There’s plenty more to say about this issue, but that’s for another entry. In general, DRS isn’t perfect because it doesn’t factor in shifts, positioning, and can’t perfectly measure everything it needs to….”
The DRS inventor above cautions a full year (well, he seems to be saying three, don’t you think?), meaning a full year of continuous data from fielding the same position. At third base, this means about 400 chances in the 1200 innings used as a full season. Or on the conservative side it means 1200 chances in 3600 innings. None of our guys have that. None of them, in fact, are even close. Their third base numbers are in dribs and drabs with Villar’s, for example, coming from a decade ago in part. Even including the long ago data, and here are the numbers for our boys:
McNeil: four years, 250 innings, 90 chances
Villar: 11 years, 791 innings, 235 chances
Davis: Five years, 864 innings, 255 chances
Guillorme: Four years, 284.2 innings, 61 chances
In DRS this is especially woefully inadequate because the nature of their system has to have adequate samples of all the different plays a third baseman is called upon to make….bunts, throws from the hole, gunning out rabbits, handling smashed 100 mph liners and short hops… and then that has to the balanced against league averages that year. Taking a tiny sliver of that, in a long span of years, is like extrapolating that Steven Matz will bat 1.000 since he went 3 for 3 in his debut.
You all know Defensive Runs Saved, every Mets fan does, because of the shame of it all. It is right there in Baseball Reference in 2019…the Mets, -86 in defensive runs saved. Worst in the National League – and not by a little! The next lowest team was the hapless Pirates at -46. Only two other teams had negative numbers, and the NL average was +31.
That was taken as gospel among Mets fans and, perhaps to some degree, by the horrified Mets management, who dumped Rosario at short, for one thing. Can’t argue with stats, right? Then, Defensive Runs Saved, the flagship product of SIS announced a dramatic revision last year which would — wait for it — count shift plays. Huh? If you had been relying on DRS for your baseball arguments on infielders’ prowess prior to 2020, say in 2019, you probably didn’t realize how they were calculating fielders’ performance on shift plays. They weren’t.
In 2019, 25.6% of major league plays as I said above, and DRS…didn’t count them. Those plays didn’t exist.
Anyway, minus 86…damn. Then, in March of this year, SIS announced a massive forensic revision as a result of their new ideas and technical toys. This makes sense and is damn standup by them, even if it makes you wonder how they walk that cat backward. It dramatically changed the rankings which were by now catechism to the industry and its fans, and, undoubtedly, drove decisions on rosters and personnel. Awkward! In the words of the spokesman, it was “a less fun update.”
Here is the good news! If you spent the last year bemoaning the Mets brutal team DRS in 2019 of -86 runs saved, well…it now is only -34! They found 52 runs. If you were howling that we had to get rid of Ahmed Rosario because he was giving up 10 runs a year, well, that was changed to a mere -3. Sorry Amed. Hope you like Cleveland and you are sure kicking ass for $2 mil per year.
Interestingly, at least here, is that the Mets as a team were the most affected by the SIS reshuffle with that 52 run change, and Rosario as a player was the most affected in the entire league. So, did the Mets get alarmed and trade off Rosario with that data? Is that a leap for me to make? Well, anyway, at least it’s fixed on BBR.
But it’s not. SIS promised the changes would be updated by the beginning of the season, and here we Mets fans are halfway through, still swimming in our shame on BBR.
Now, remember, Amed was at -10 in 2019. His reputation shattered (drama). What we were writing about? Oh yeah, J.D. Davis? -9.
In the Defensive Runs Saved revisions…okay, does anyone care by now? Are we in agreement that between the sampling and the fledgling technology and the revisions, DRS is a pretty dumb topic right now? I could keep going through the absurdities, and I will if requested, I have it all drafted, but I think the point is made. And these same issues are easily carried over to the other major advanced metrics.
A well-respected stat, Outs Above Average by Statcast, has been around for years. But only for outfielders. It was only introduced for infielders (a much, much more complex undertaking) right before last year’s abbreviated season. Link: OAA introduced for infielders in Feb. 2020. Will they be announcing massive revisions in a few years? How could they not?
Bottom line: J.D. Davis has shown not only outstanding, but historic performances at the plate. In J.D.’s first 162 games with the Mets he slashed .304/.374/.512/.886 with 25 home runs.
How often in the franchise’s history has a new Met hit for, say, a .300 average with 25 home runs and an .885 OPS in first 162 games with the team?
Three times:
Well, the first happens to be no shock. Mike Piazza, six-time All-Star and future Hall of Famer, topped those numbers when he came here in 1998. In 1996, Bernard Gilkey, a seven-year vet, had a career year his first year with the Mets with those numbers. And then J.D., two decades later, in his first full major league season. And that is it.
In fact, in the National League since 2017, only Christian Yelich matched those metrics in his first year with Milwaukee. He won the MVP.
Now…why would Mets fans, or any fanbase, not be in love with a new player who produces at that level? J.D. Davis has at worst gotten a bum rap on his defense and at best, the jury should be very much out. He is a very special player with an elite bat.
If you listen with fresh ears, also, I think you will note that Gary, Keith and Ron have a little bit of an edge with him. Any flaws are immediately tucked into a narrative of poor defense that is trotted out again. With the other guys, Guillorme, Villar, McNeil, the opposite is the case. Just for one example…can you IMAGINE if J.D. Davis had been picked off third in extra innings the way Villar was? Omigosh, we’d hear it every time he got on base.
J.D. Davis has gotten a raw deal with his reputation on defense, due to the reliance of flawed fledgling statistics with woefully small samples. He should be put in the lineup at third base, batted fifth, and check him again in five years And the LAST thing we should do is trade him.
* * * * * * *
This MMO Fan Shot was contributed by Greg Jones. Have something you want to say? Share your opinions with the best and most diverse Mets community on the web! Send your Fan Shot to [email protected].


