
(Photo: Howard Smith/USA TODAY Sports)
There has been much debate among Mets fans over David Wright. How will he decline, his contract, and most importantly, how good he still is. They have all been controversial issues.
For many, the home run totals are enough to say Wright is getting worse. In fact, the slight decline in power has been almost the sole reason why Wright is considered by some to be a “shell” of his former self. (Well, that and the ridiculous RBI argument.)
The truth is that in the past two seasons, David Wright has been as good as he’s ever been. The mirage of a decline put forward by critics have only been a result of the new run environments, the lineup that surrounds him, and sample size.
The Effects of Citi Field on Wright’s Power
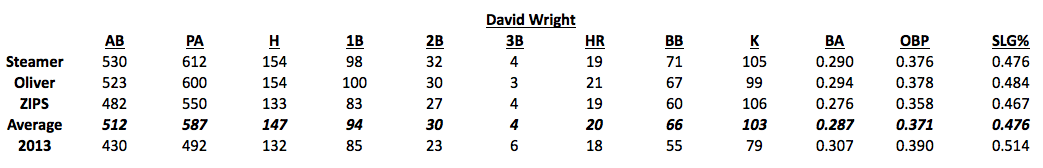
Home runs have never been the defining aspect of David Wright’s offense. He has always been a well-rounded player who can produce in a variety of ways. However, Wright’s home run totals have come under intense scrutiny the past few years. Per 162 games, Wright averaged 30 home runs from 2005 through 2008. Over the past two seasons, this number has been just 24.
The run environment at Citi Field have been what’s driven his home run total down. Let’s look at his home run totals at home going back to 2005 and the percentage of his yearly total it made up.
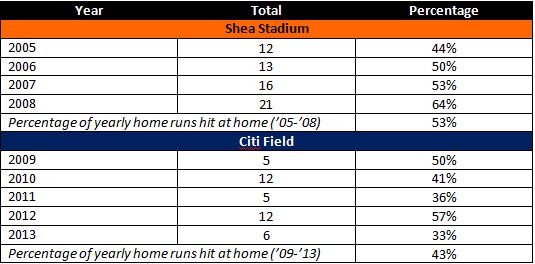
So far, we see that Wright has seen a drop in his home runs at home. His home run dropped by 50 percent, but he has lost a few home runs per season, which matches up with the percentage pretty well.
Now let’s look at home runs per fly ball. If Wright is hitting more fly balls and getting fewer home runs out of them, that may speak to the dimensions of the ballpark. Let’s look at that number, split for his home games, going back to 2005.
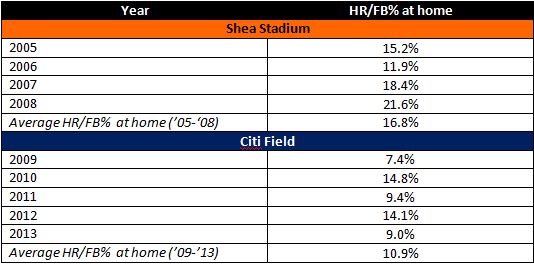
Again, this justifies the theory that fewer of his fly balls at home are going out of the ballpark.This trend isn’t due to Wright becoming a different type of hitter, either. Wright’s batted ball ratios have each stayed consistent, even in the switch from Citi Field, as the following graph from Fangraphs will show.
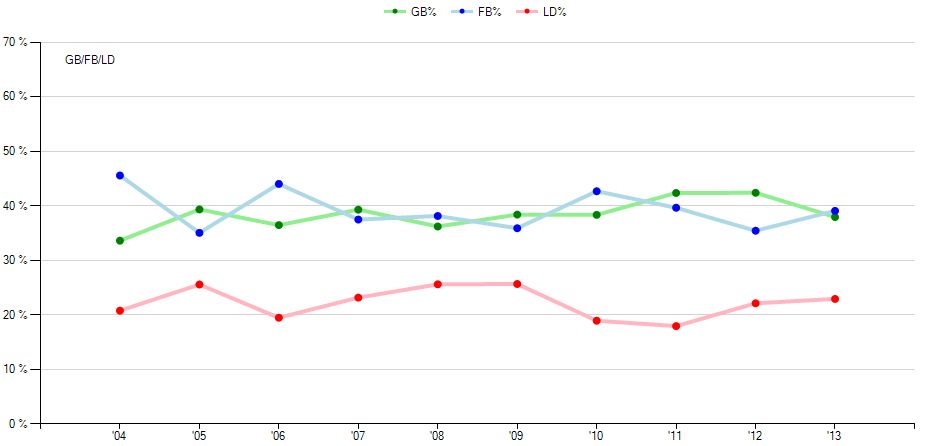
(Click for larger image)
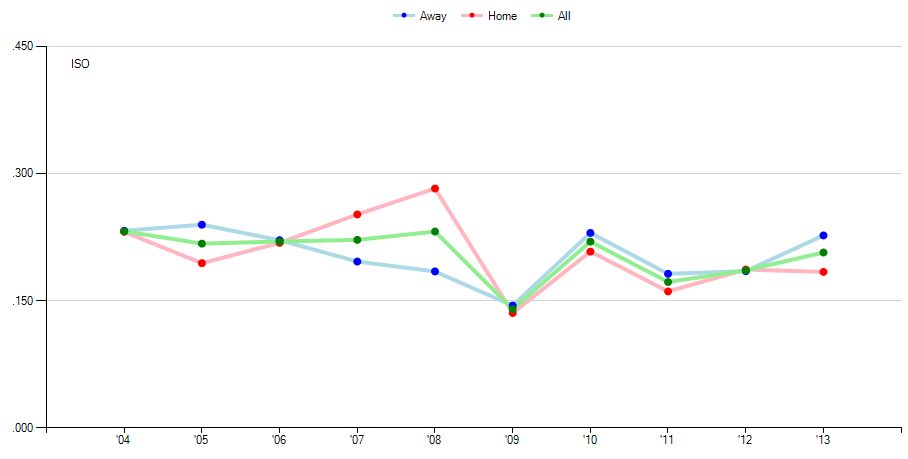
Finally, for one last look at the decline in power, we’ll look at Wright’s ISO. For those who don’t know, ISO is the difference between a hitter’s Slugging Percentage and Batting Average. Generally, it gives a good sense of a player’s overall power, and not just exclusively home runs.
(Click for larger image)
Here, we see a distinct decline in power at home. Wright used to have an ISO at home significantly above his yearly total and yearly road ISO. However, in recent years, specifically since the move to Citi Field, that number has moved below what it is on the road and for the year.
Obviously, Wright’s lesser power numbers can be attributed to the home park, as his power numbers on the road are no different than what they were in 2005 through 2008.
Wright Relative to the League
It’s always necessary to, when analyzing a player, put them in context of the league environment. During David Wright’s early career, he was playing in the back-end of the steroid era, where better hitters were easier to come by and the league averages for most offensive categories were higher. Today, the game is different. Pitching is much more dominant today and offensive numbers are sagging.
Relative to the league, Wright looks just as, and at times, more impressive than he was in those early years. In that first period (’05-’08), Wright’s OPS+ was 141. His OPS+ the past two seasons has been 149. In plain words, he is eight percent better compared to league average now than he was then.* wRC+, a stat that neutralizes some of the problems of On-Base Percentage and Slugging Percentage (the two most critical parts of OPS+), says roughly the same thing about Wright.
It’s easy to look at Wright’s raw numbers and say that he’s a lesser player than he was years ago, just as it’s easy to say, just by looking at out-of-context statistics, that Barry Bonds was better than Babe Ruth. Context is important, even in this case.
The Absurd RBI Argument
I’ll say it right now: I don’t like the RBI statistic. A traditionalist bread and butter stat, I give it no weight when talking about a player. RBI, just like pitcher’s wins, are so dependent on the team around you that it’s just not worth it. The point of looking at individual statistics is to isolate the production of that one particular player. This statistic, created by a cricket newspaper writer in the late 1800s (still baseball’s infancy), doesn’t do it for me. However, although stats like these are all but completely gone from MLB front offices, many traditionalist and casual fans still use it, and Mets fans especially use it to point to David Wright’s supposed decline.
Yes, Wright’s RBI numbers have declined. This can be attributed to two things: 1) his decrease in power (at home) thanks to the new home dimensions and 2) the team around him just isn’t the same as it used to be.
From 2005 through 2008, Wright was sixth in baseball in runners on with 1845. He “drove in” 18.05 percent of those baserunners. In roughly 40 more games from 2009 through this past season, Wright has had 1859 baserunners on and driven in 15.87 percent. Only in a bigger sample size of games did he reach the same number of baserunners.
It’s also important to keep in mind that not only is the number of baserunners on important, but also how they get on base. In a better offense, Wright had more hitters on second and third base than he has had in recent years. in the earlier period, hitters like Carlos Delgado and Carlos Beltran were hitting and getting on base in front of him, while he hasn’t had quite the same quality hitters in front of him recently.
Sample Size
What’s the easiest way to twist data? For baseball statistics, it’s through sample size. One commentor pointed out that Wright’s average home run total from 2005 through 2008 was 29, while that number has dropped the past few seasons, specifically to 20 the past two seasons. While that’s true, it’s a complete misinterpretation of what has been given.
From 2005 through 2008, Wright averaged 158 games played. The past two years, he’s averaged 134. Neutralizing the difference in sample size would bring Wright to around 24 home runs, give or take one or two. That drop remains consistent with what we’ve explored so far.
Sample sizes are relevant for all the topics discussed and the idea is probably one of the most important things when it comes to evaluating Wright. His totals are lower, but they can not only be shown to be mostly out of his control, but those lower totals and averages shoved in the faces of Mets fans by his critics are often misconstrued by the fact that he has missed significant time due to injury recently.
* * *
If anything, Wright has been shaped into a different hitter than he was years ago. He hits for less power but his defense may be better than ever. His numbers have changed due to a number of things that he has very little control over.
To expect Wright to still post the same numbers despite all these obstacles (which effect almost every baseball player) is just irresponsible and completely ignorant of how baseball statistics are shaped jointly by both the player and the situation.
*OPS+ Explanation (written by me)
Follow me on Twitter @UpAlongFirst


