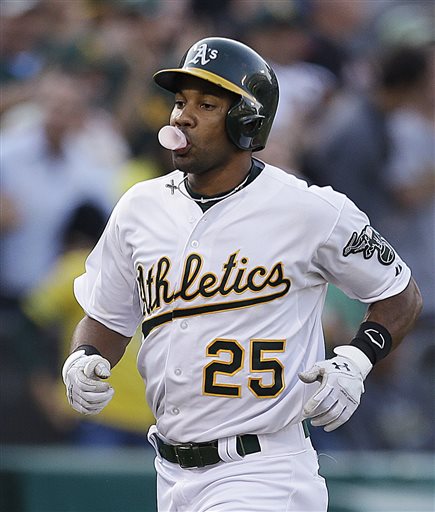
Chris Young has 20/20 potential. There is no doubting his ceiling is high—he is a former All-Star who plays excellent defense. The problem has been that since his breakout 2010 season, where he batted .257, hit 27 homeruns, and stole 28 bases, his offensive numbers have been on the decline.
But somewhere in there, when you scrape away the strikeouts and the Mendoza Line, lies a guy that is ready to bust out offensively.
What has caused Young to struggle offensively since his back-to-back 20/20 seasons in 2010 and 2011? Is he simply on a decline, or is there really a chance that this guy is going to break-out in 2014 for the Mets?
Let’s take a look at some numbers to see if we can figure this enigma out.
When looking at Young’s pitch types over the past few years, going back to 2010, there seems to be an interesting trend. Young has seen a dramatic increase in the amount of changeups he has been getting, and seeing less sliders and curveballs. It seems that pitchers are trying to keep Young off-balance by changing speeds, and not with a steady diet of breaking balls.
As I did in a previous post on Lucas Duda, the next thing to look at is his plate discipline, to see if he is making the proper adjustments.
When looking at his swing and contact rates, not much has really changed over the past few years that would lead one to believe that Young is in decline. Take a look at the table below:
Young’s O-Swing% has actually increased, which means he is swinging at more pitches out of the strike zone than he did in 2010. His Z-Swing% has also increased—so overall, Young is swinging at more pitches. But here is the interesting stat—Young’s contact rate has remained relatively flat over the past four seasons, and actually improved in 2012. This would signal to me that Young is doing a good job adjusting, as his contact rate has not dropped of significantly as we saw in the Duda analysis.
So if Young is swinging at more pitches, and making contact at the same rate as he did in his 2010 and 2011 season, where is the problem?
The answer can be found in his BABIP (batting average on balls in play). Young’s BABIP has steadily declined, meaning that pitches that he is making contact with, and putting in play, are being reeled in as outs. Young’s ground ball percentage has decreased since 2010, while his line drive percentage has increased. His fly ball percentage has remained flat, and his HR/FB ratio has also slightly dipped.
What does this all mean?
Young is not a player that is on the decline. His contact rate has remained the same over the past four seasons. The major difference seems to be that he is hitting less ground balls and more line drives. That doesn’t sound like a bad thing, but a line drive has better chance of being caught in flight for an out, and they prevent Young from using his speed to leg out some of those ground balls. His HR/FB ratio also dropped, meaning some of those fly balls have become outs.
Young has basically had some bad luck over the past two years. He is a streaky player, so there will be times this season when he goes on a tear, and others when Mets fans may be questioning why Sandy Alderson brought him to New York.
However, if Young can reverse his fortune and sustain his hot streaks, Mets fans will be pleasantly surprised with Chris Young in 2014.


