So the big ticket purchases of the off-season are done, the core of the team is set and as fans, we have three things to focus on.
- Counting down to Pitchers and Catchers reporting in Port St. Lucie by watching the front page of MetsmerizedOnline.com.
- Check on the final touch-ups, like if we trade the 26th man on the roster for more than a bag of balls.
- Playing around with lineups for what should be an exciting season.
All of these are admirable ways to whittle down the days until they raise the flag for the 2015 National League Championship. With the added pieces to the infield, a full season on Matt Harvey’s arm and Steven Matz starting the season in Queens, the foundation is in place for a great team.
But how good is the outfield?
That’s been the big question for the better part of a decade, one that’s seen luminaries like Victor Diaz, Jay Payton, Ryan Church, Andres Torres and Jason Bay roam around in Orange and Blue…he wrote with heavy sarcasm. The fact is, the Amazin’s have never featured a great outfield…and here are the stats to prove it.
Using Baseball-Reference, I’ve complied some numbers to determine which year in franchise history posted the best 7-8-9. Since DRS or Defensive Runs Saved, as defined by FanGraphs, was only created in 2002, I’ve added Rtz, or Total Zone Fielding Runs Above Average; basically the equivalent of DRS pre-2002 according to FanGraphs.
But since offense rules the day, I’ve used the combined oRAR or Offensive Runs above Replacement Level for the total. I’ve also included other stats so you can get a good feel for just how bad this group has been for more than 50 years.
I didn’t look up numbers from the really pathetic years, so you’re not going to see the WAR for a 36-year-old Duke Snider back in 1963 (It was 1.2). Instead, you’ll see a collection of winning seasons like the first one in…
1969 Mets (100 W – 62 L) – Total OF oRAR = 94
|
Player |
oRAR |
Rtz |
WAR |
AVG
|
OPS |
HR |
RBI |
| LF – Cleon Jones | 52 | 11 | 7.0 | .340 | .904 | 12 | 75 |
| CF – Tommie Agee | 37 | 10 | 5.2 | .271 | .806 | 26 | 76 |
| RF – Ron Swoboda | 5 | 2 | 0.5 | .235 | .687 | 9 | 52 |
Let this be the first sign that our beloved franchise is founding on pitching. Cleon Jones clearly had an amazing year with a top 5 WAR for position players, but his OPS was only good enough for ninth in the league and he finished a distant 7th for the NL MVP behind teammates Tommie Agee and The Franchise, who finished second.
1973 Mets (82 W – 79 L) – Total OF oRAR = 34
With Willie Mays in CF. with Don Hahn who started 93 games, it’s 31.
|
Player |
oRAR |
Rtz |
WAR |
AVG |
OPS |
HR |
RBI |
| LF – Cleon Jones | 6 | 0 | -0.4 | .260 | .710 | 11 | 48 |
| CF – Don Hahn | -3 | -3 | -1 | .229 | .575 | 2 | 11 |
| RF – Rusty Staub | 28 | -2 | 2.1 | .279 | .781 | 15 | 76 |
| Willie Mays | 0 | 4 | -0.0 | .211 | .647 | 6 | 25 |
Sadly, this is Willie’s worst season as a professional. Granted, he was 42 at the time and showcased his age on the grandest stage of them all. But just a year earlier when he was traded back to New York, he hit .267 with a .848 OPS with a 1.6 WAR.
I could bore you with numbers from the rest of the 1970s, but the less said about Del Unser in center field, the better.
Basically, you have to fast forward to the next time Shea sparkles in October…
1986: Team Record (108 W – 54 L) – Total OF oRAR = 103
With Mookie Wilson in LF, who started 80 games and appeared in 123 games. The number drops to 88 with George Foster, who started 62, but only finished 38 and was eventually released in August.
|
Player |
oRAR |
Rtz |
WAR |
AVG
|
OPS |
HR |
RBI |
| LF – Mookie Wilson | 23 | 2 | 3.0 | .289 | .775 | 9 | 45 |
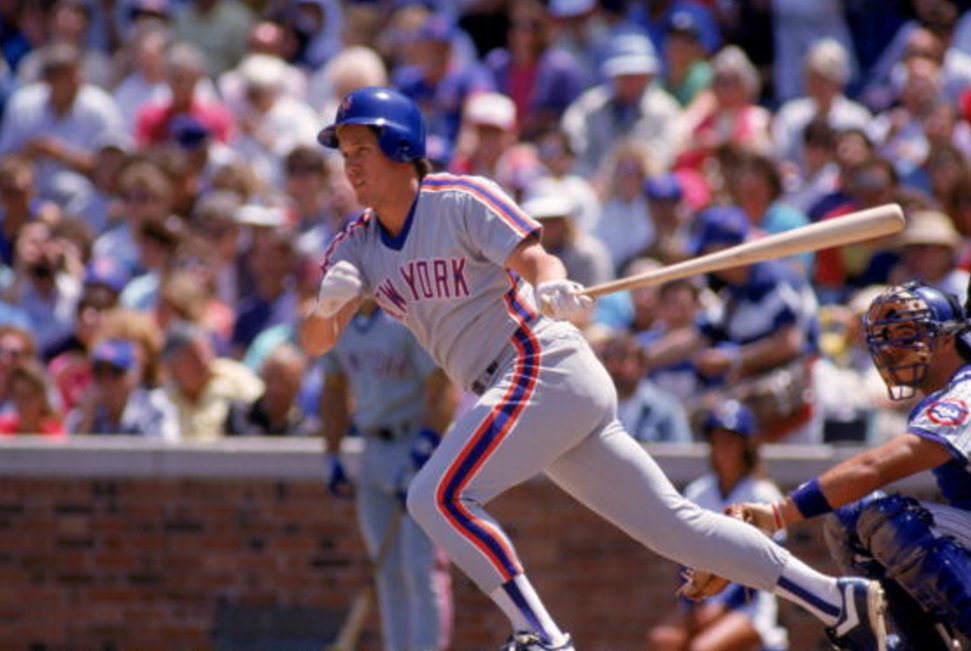
| CF – Lenny Dykstra | 41 | 2 | 4.7 | .295 | .822 | 8 | 45 |
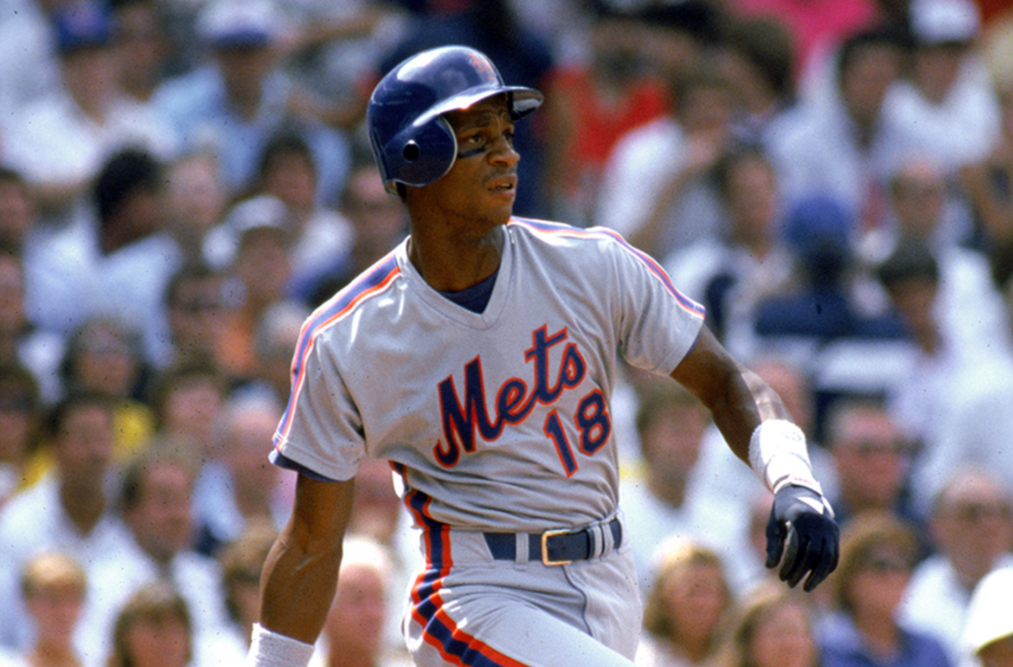
| RF – Darryl Strawberry | 39 | -7 | 3.4 | .259 | .865 | 27 | 93 |
| George Foster | 8 | -3 | 0.4 | .227 | .718 | 13 | 38 |
Upon first glance, this would seem to be the gold standard, especially since they won the World Series. But as Nick Bakay once said, the numbers never lie.
1987 Mets (92 W – 70 L) – Total OF oRAR = 142
|
Player |
oRAR |
Rtz |
WAR |
AVG |
OPS |
HR |
RBI |
| LF – Kevin McReynolds | 33 | -3 | 2.6 | .288 | .832 | 27 | 99 |
| CF – Lenny Dykstra | 29 | 4 | 3.8 | .270 | .706 | 8 | 33 |
| RF – Darryl Strawberry | 57 | -6 | 6.4 | .269 | .911 | 39 | 101 |
While this trio returned in 1988 with similar numbers (Total WAR 13.4, Total oRAR 136), they had a better oRAR in 1987 when the team fell three games short of the NL East champion St. Louis Cardinals and Strawberry finished sixth in the NL MVP voting. They clearly weren’t the best defenders, but that’s another trend since defense only seemed to matter in 1969.
1999 Mets (97 W – 66 L) – Total OF oRAR = 79
With Darryl Hamilton, who was traded for on July 31 to replace Brian McRae, who the team had a total of oRAR of 64 with.
|
Player |
oRAR |
Rtz |
WAR |
AVG |
OPS |
HR |
RBI |
| LF – Rickey Henderson | 36 | -11 | 1.8 | .315 | .889 | 12 | 42 |
| CF – Brian McRae | -0 | -19 | 2.2 | .221 | .669 | 8 | 36 |
| RF – Roger Cedeno | 28 | -7 | 1.5 | .313 | .804 | 4 | 36 |
| OF – Darryl Hamilton | 15 | -1 | 1.2 | .339 | .898 | 5 | 21 |
Hamilton hit .315 with a .808 OPS for the year in what could have been the best deadline deal (Hamilton and Chuck McElroy for Thomas Johns (minors), Rigo Beltran and McRae) before Cespedes. Especially since he hit .280 (7-for-25) before watching Kenny Rogers throw a full-count ball four to Andruw Jones with the bases loaded.
A year later, they may have reached the World Series, but the outfield of Derek Bell, Jay Payton and immortal Benny Agbayani had little to do with it, posting a Total oRAR of 59 with a combined WAR of 5.8. The next time the outfield makes a difference is…
2006 Mets (97 W – 65 L) – Total OF oRAR = 83
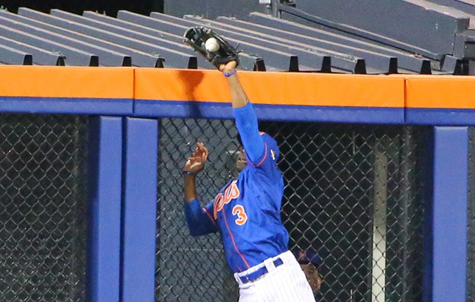
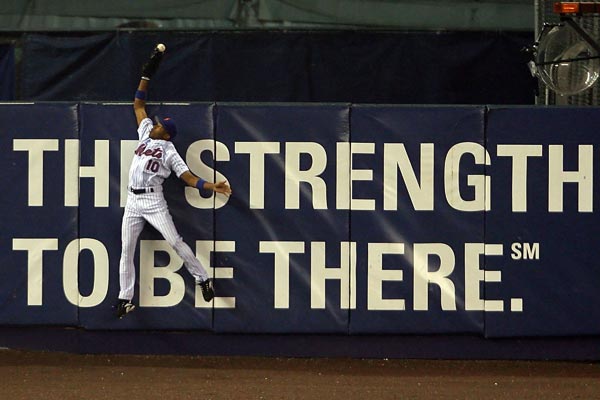
But it’s 89 if you replace Xavier Nady with Endy Chavez who starts 79 games, finishes 73 of them and makes one of the greatest catches to be forgotten by everyone except Met fans.
|
Position & Name |
oRAR |
Rtz |
WAR |
AVG |
OPS |
HR |
RBI |
| LF – Cliff Floyd | 3 | 3 | -.4 | .244 | .731 | 11 | 44 |
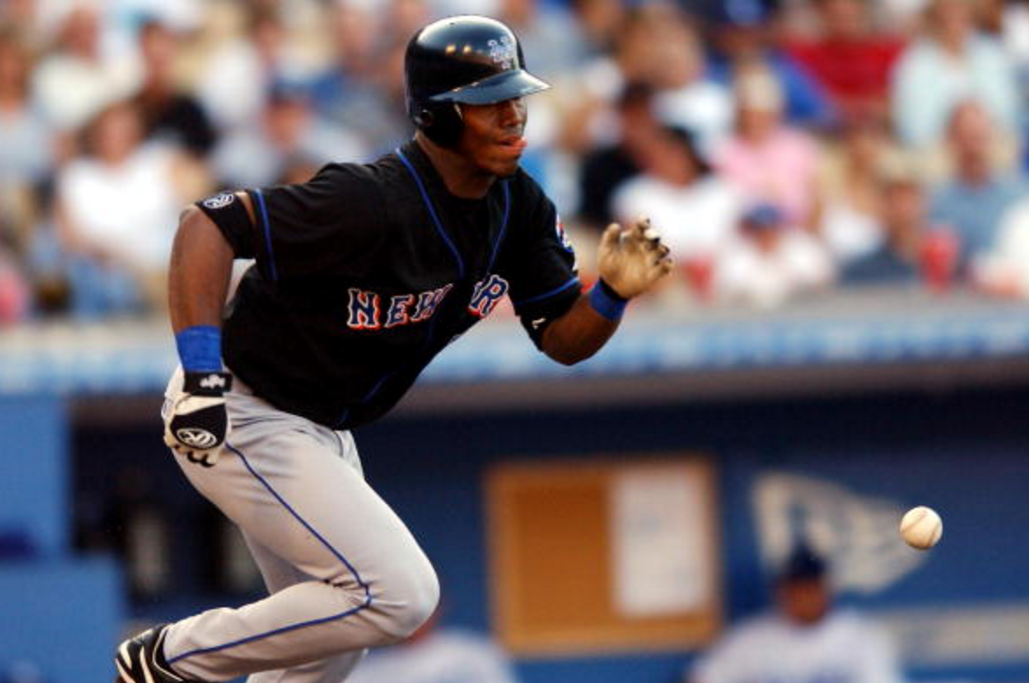
| CF – Carlos Beltran | 73 | 7 | 8.2 | .275 | .982 | 41 | 116 |
| RF – Xavier Nady | 7 | -6 | .6 | .264 | .813 | 14 | 40 |
| OF – Endy Chavez | 13 | 11 | 1.8 | .306 | .814 | 4 | 40 |
In 2005, the outfield featured Victor Diaz and the experiment of Mike Cameron in left field. The total oRAR that year was 85 with a four-man total WAR of 9.9. But sadly, the numbers trended a little downward in the following seasons.
2007 – Total oRAR 82, Total WAR 7.9 (Beltran, Moises Alou and Shawn Green)
2008 – Total oRAR 84, Total WAR 9.6 (Beltran, Fernando Tatis and Ryan Church)
On a side note, if you’ve got a few moments take a look at Beltran’s numbers in a Met uniform. I never understood why so many people wanted to put him down. Clearly a very under-appreciated Met.
I’ve gone on long enough, especially since the next and final group worth mentioning took the field last year.
2015 Mets (92 W – 70 L) – Total OF oRAR = 91
|
Player |
oRAR |
Rtz |
WAR |
AVG |
OPS |
HR |
RBI |
| LF – Michael Cuddyer | 11 | 2 | .5 | .259 | .699 | 10 | 41 |
| CF – Juan Lagares | 6 | 6 | .6 | .259 | .647 | 6 | 41 |
| RF – Curtis Granderson | 40 | -1 | 5.1 | .259 | .821 | 26 | 70 |
| Yoenis Cespedes | 23 | -1 in CF, 6 in LF | 2.3 | .287 | .841 | 17 | 44 |
| Michael Conforto | 11 | 5 | 2.1 | .270 | .841 | 9 | 26 |
So last year’s Total WAR of 10.6 makes them a little better than the 2006 team, but you have to go back 20 more years for the best offensive group after that. I will admit after digging through all these numbers and reading New York Post columnist Kevin Kernan’s report about how Collins believes Cespedes will easily handle center field, with a full spring training at the position, I’m willing to accept the best OF is Conforto, Cespedes and Granderson.
This year’s group, which also includes Lagares and De Aza, has a very good chance of becoming the most productive outfield we’ve ever seen in Flushing. Now if we can only get Lucas Duda ahead of Cespedes in the lineup so pitchers have to throw him fastballs…


